8.8 Dashboard Configuration
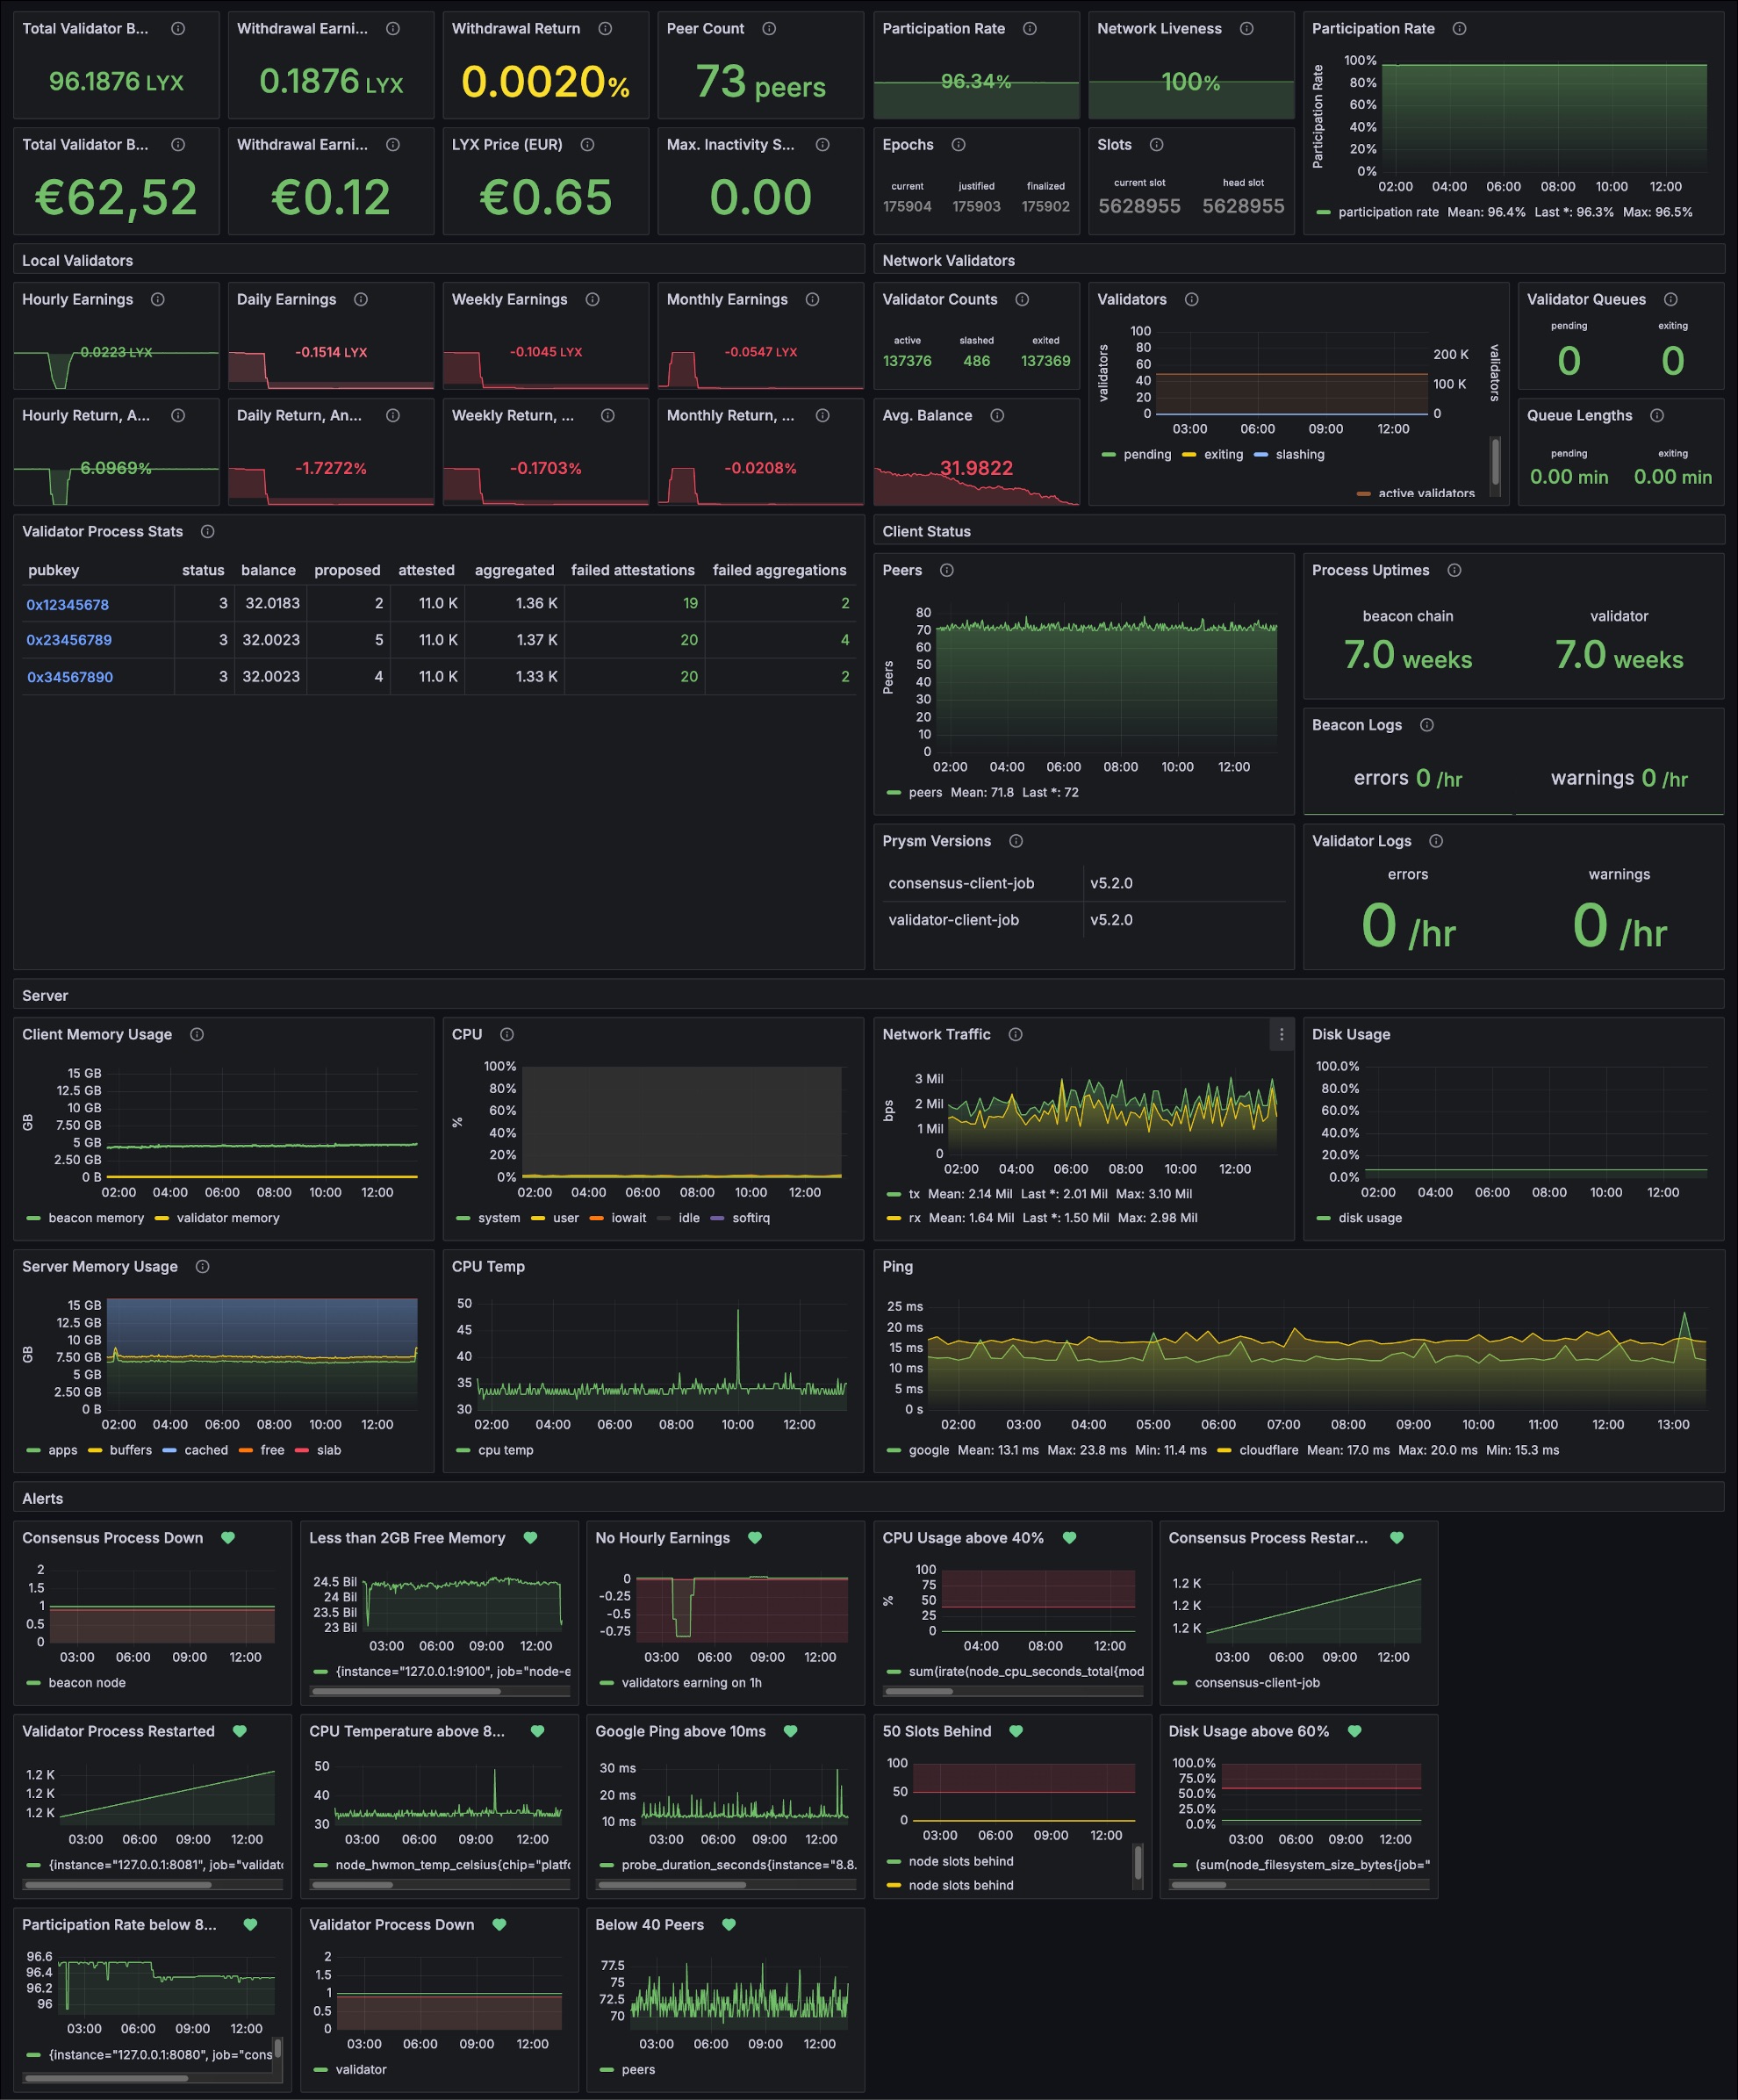
A Grafana dashboard is a powerful interface for visualizing real-time metrics, allowing node operators to monitor client performance, hardware usage, validator income, and network health. This guide will cover how to configure the dashboard interface after previously setting up the Prometheus data collector and exporter services.
Further details about node analytics can be found on the Monitoring Tools page in the 🧠 Theory section.
The following step is performed on your 📟 node server.
1. Resolve IP Address
- Local IP Check
- Public IP Check
You can use the ip tool to display the system’s default package route and source IP when connecting to the router. The default gateway's IP address is the intermediate route the system takes when sending data to an IP address outside its local network.
ip route show default
The output will look like this:
default via <GATEWAY_IP_ADDRESS> dev eno1 proto dhcp src <NODE_IP_ADDRESS> metric <ROUTING_WEIGHT>
You can use the ip tool to query a stable external address like the Google DNS address 8.8.8.8 to reveal your source IP and further filter the IP parameter from the server's response using the text-processing tool awk.
ip route get 8.8.8.8 | awk '{print $7}'
Remember or copy your node's IP address, then log out of your node and continue using your personal computer's browser.
exit
The following steps are performed on your 💻 personal computer.
2. Access Web Interface
Open your browser and access your node's IP address on the previously opened Grafana port.
http://<static-node-ip>:3000
Exchange your-static-node-ip with the actual retreived IP address.
The default login credentials to the Grafana dashboard will be the following:
DEFAULT CREDENTIALS
-------------------
username: admin
password: admin
Set a new secure and long password when prompted by Grafana. Security is vital as this page will be exposed through VPNs.
3. Add Prometheus Data Source
By default, Grafana is not listening to any metrics that were previously set up using Prometheus and all it's data sources. You have to first attach the running Prometheus service to the Grafana Dashboard so it can listen and gather metrics in it's own database.
- Open the Burger Menu icon on the left side
- Click Connections to manage data sources
- Clic Data sources on the left menu bar
- Click the Add Data Source button at the top right
- Click the Prometheus card in the middle screen
- Enter
http://127.0.0.1:9090/as URL to listen for data - Click Save & Test before continuing with the setup
You should see a green Data source is working checkmark before continuing to import the dashboard.
4. Import Dashboard
After configuring the data source, you can continue to add the dashboard to vizualize the collected data and configure alerts. This guide already comes with a set of prebuilt Grafana templates that are ready to use. If you want, those dashboards can later be adjusted and modified to further customize your experience.
- Navigate to the 📝 Template section of this page
- Choose the JSON File based on your Consensus Client, Grafana Version, and Fiat Currency.
- Copy the raw JSON File contents by opening the file with a text editor
- Open the Grafana Landing Page by clicking on the logo on the top left
- Click the Plus Icon on the top right corner of the page
- Click on Import Dashboard to add a new interface
- Paste the raw contents to the Import via Panel JSON text box
- Click the Load button to apply validity checks
- Click the Import button to install the dashboard
If you chose different Ports or Prometheus Job-Names, you will have to modify and match all configuration files.
- Consensus client ports can be adjusted within the Prometheus Dataset Configuration.
- Price Conversions require updating the JSON Explorer Configuration and Prometheus Dataset Configuration.
- Job Names of the Prometheus Dataset must match the Jobs of the Grafana Dashboard.
Great and free examples of editors with JSON formatting are 🦎 Notepad++ or 🔹 Visual Studio Code.