8.9 External Monitoring Tools
Instead of only using local monitoring tools like Prometheus and Grafana, there are a bunch of web-based service tools that help track node performance and validator duties from anywhere. These platforms typically focus on uptime, validator proposals, reward tracking, and network participation rates. This means node operators are not solely relying on local metrics and alerts, but can also gain external insights as a second safety net.
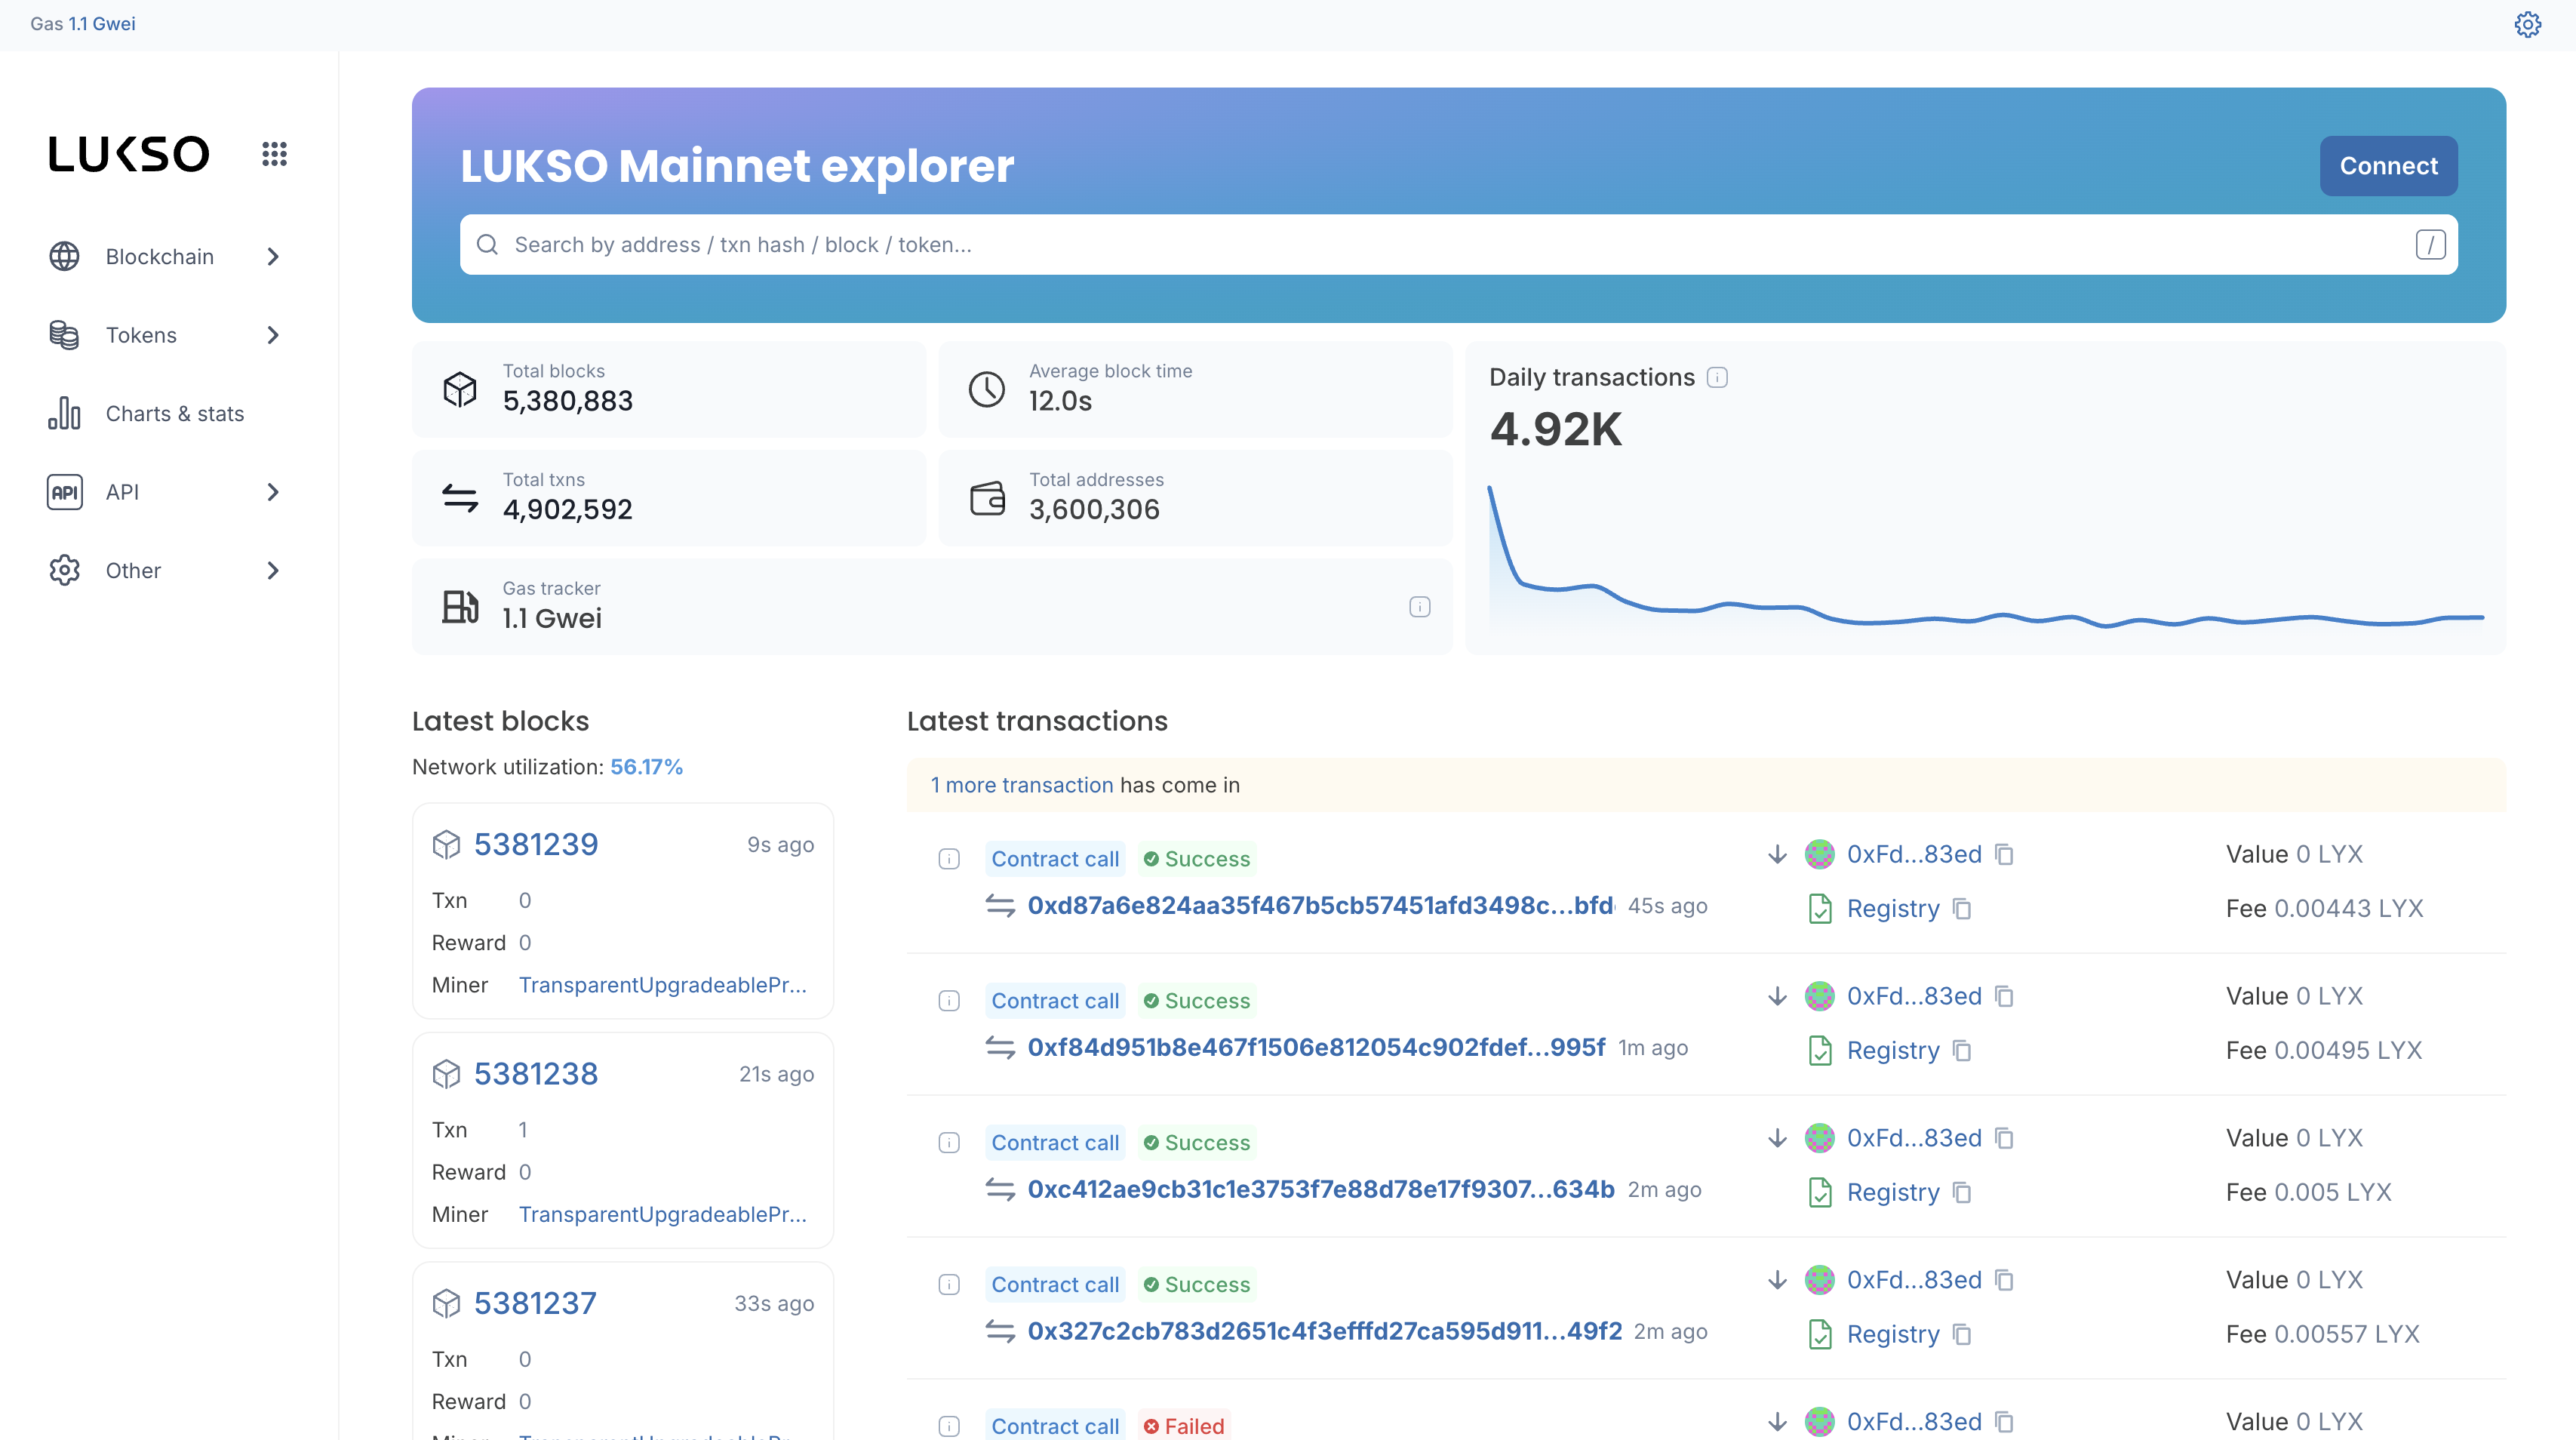
Execution Block Explorer
The Execution Block Explorer is a valuable tool for examining detailed transactions and blocks. The serivce provides data like who validated the block and the number of blocks a certain validator has validated in total. Additionally, the tool displays the balance of the transaction recipient's fees addresses.
Execution Status Page
The Execution Status Page is crucial for tracking your node's overall health and performance. If you received an ETHStats secret from the LUKSO Team prior to the Mainnet Launch, the service provides the public node names, their execution client versions and types, latencies, and the number of their current peers. It also shows their pending transactions based on their current gas price configuration, the last synced block and its hash, as well as the timing of the last block.
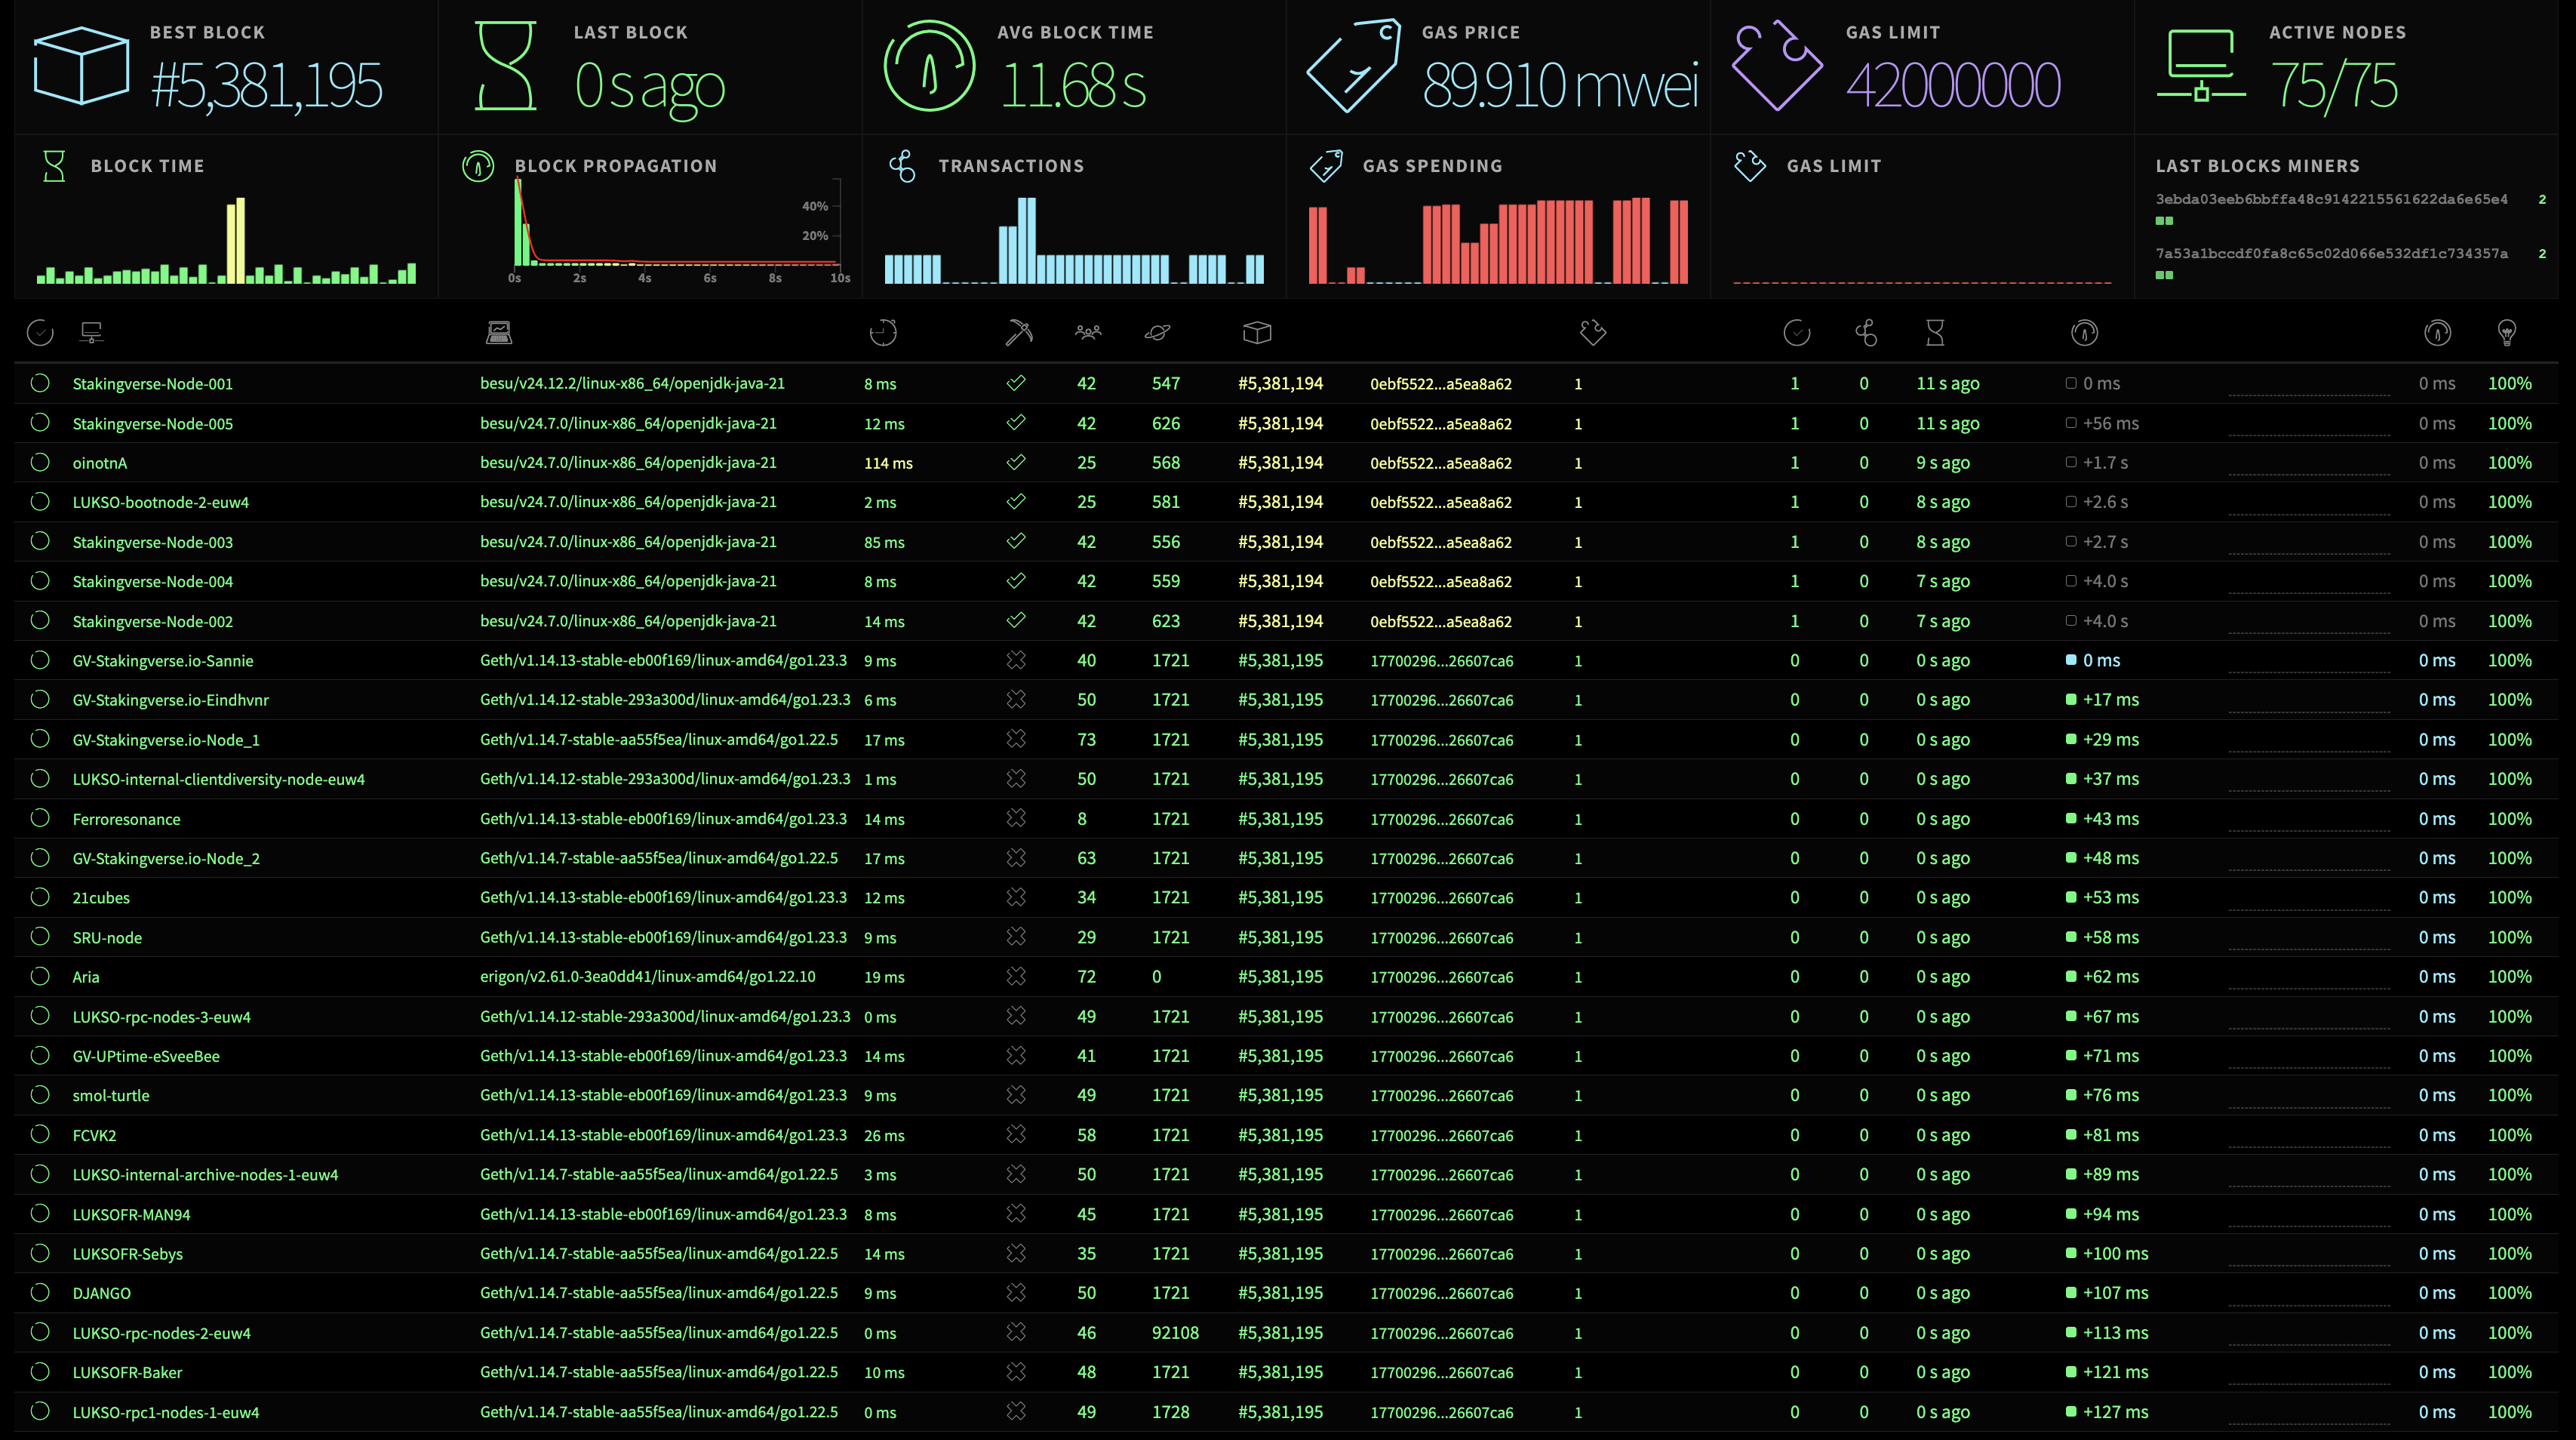
A guide on how to list your node on an Execution Status Page can be found on the Execution Dashboard page.
Both, the LUKSO Community and the LUKSO Team are running Execution Status Pages. While the community dashboard is open for everyone, the LUKSO Team only list nodes of core contributors that got in contact via the LUKSO Discord Server.
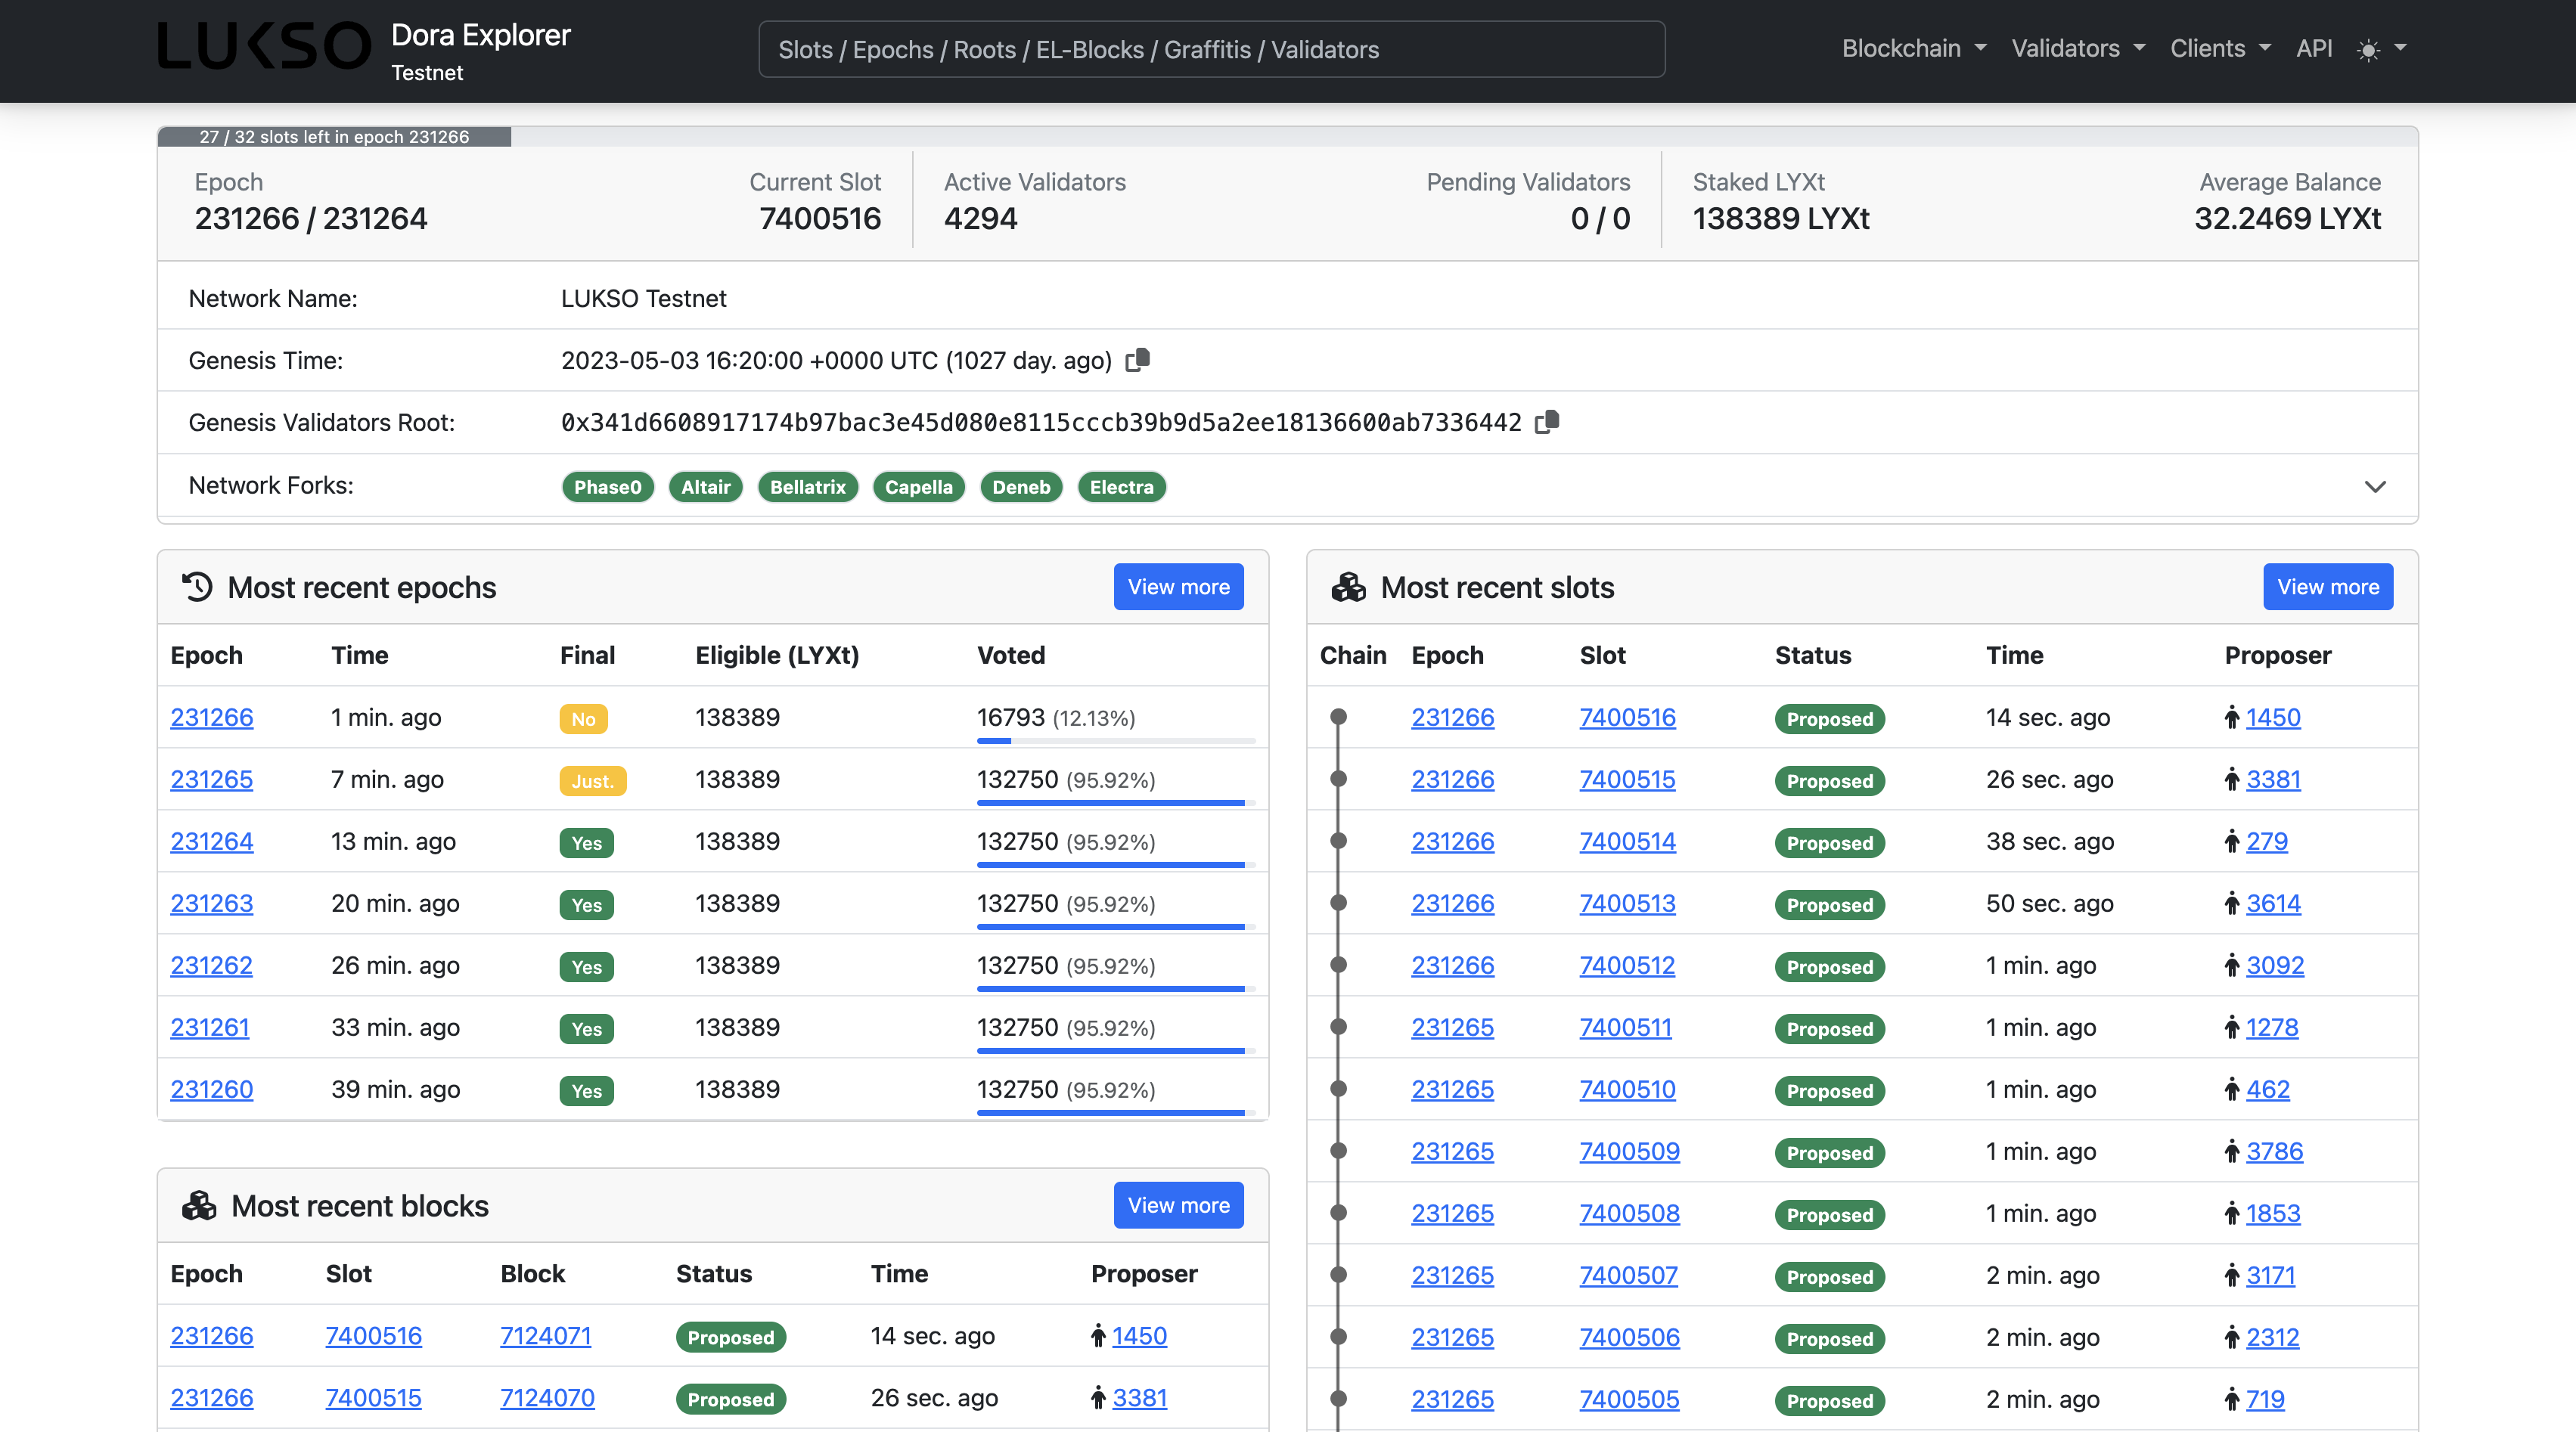
Consensus Block Explorer
The Consensus Block Explorer offers comprehensive insights into the current consensus status. It displays the present epoch, slot, active and pending validator counts, the total staked LYX, and the average balance. For each slot, the explorer provides information about the proposer, the sync participation, time, and status. On top, the explorer also allows for an in-depth examination of each block, revealing the proposer's graffiti and all associated metadata.
From the validator's perspective, it provides critical information about attestations and deposits, the validators' status and effectiveness, and their balance. Validators can even check for slashed nodes and withdrawal status.
- Mainnet Consensus Explorer ↗
- Mainnet Consensus Slashing Board ↗
- Mainnet Consensus Withdrawals and BLS Changes ↗
- Mainnet Consensus Slot Inspector ↗
- Testnet Consensus Explorer ↗
- Testnet Consensus Slashing Board ↗
- Testnet Consensus Withdrawals and BLS Changes ↗
- Testnet Consensus Slot Inspector ↗
For further details about slots, epochs, and status types, look at the Proof of Stake page in the 🧠 Theory section.
External Validator Checks
The consensus explorer is considered the main status page for validators when it comes to monitoring uptime, withdrawals, block proposals, and earnings. You can either use the
- Withdrawal Dashboard: Summarized overview for all validators linked to the same withdrawal address.
- Validators API: Detailed validator incices analytics in JSON format.
The links of both versions can be bookmarked in your browser.
- Withdrawal Dashboard
- Validator API
- Mainnet
- Testnet
Open the LUKSO Mainnet's Dora Explorer and input your withdrawal address too see all linked validators, their total uptime rate and balance, and various withdrawal metrics.
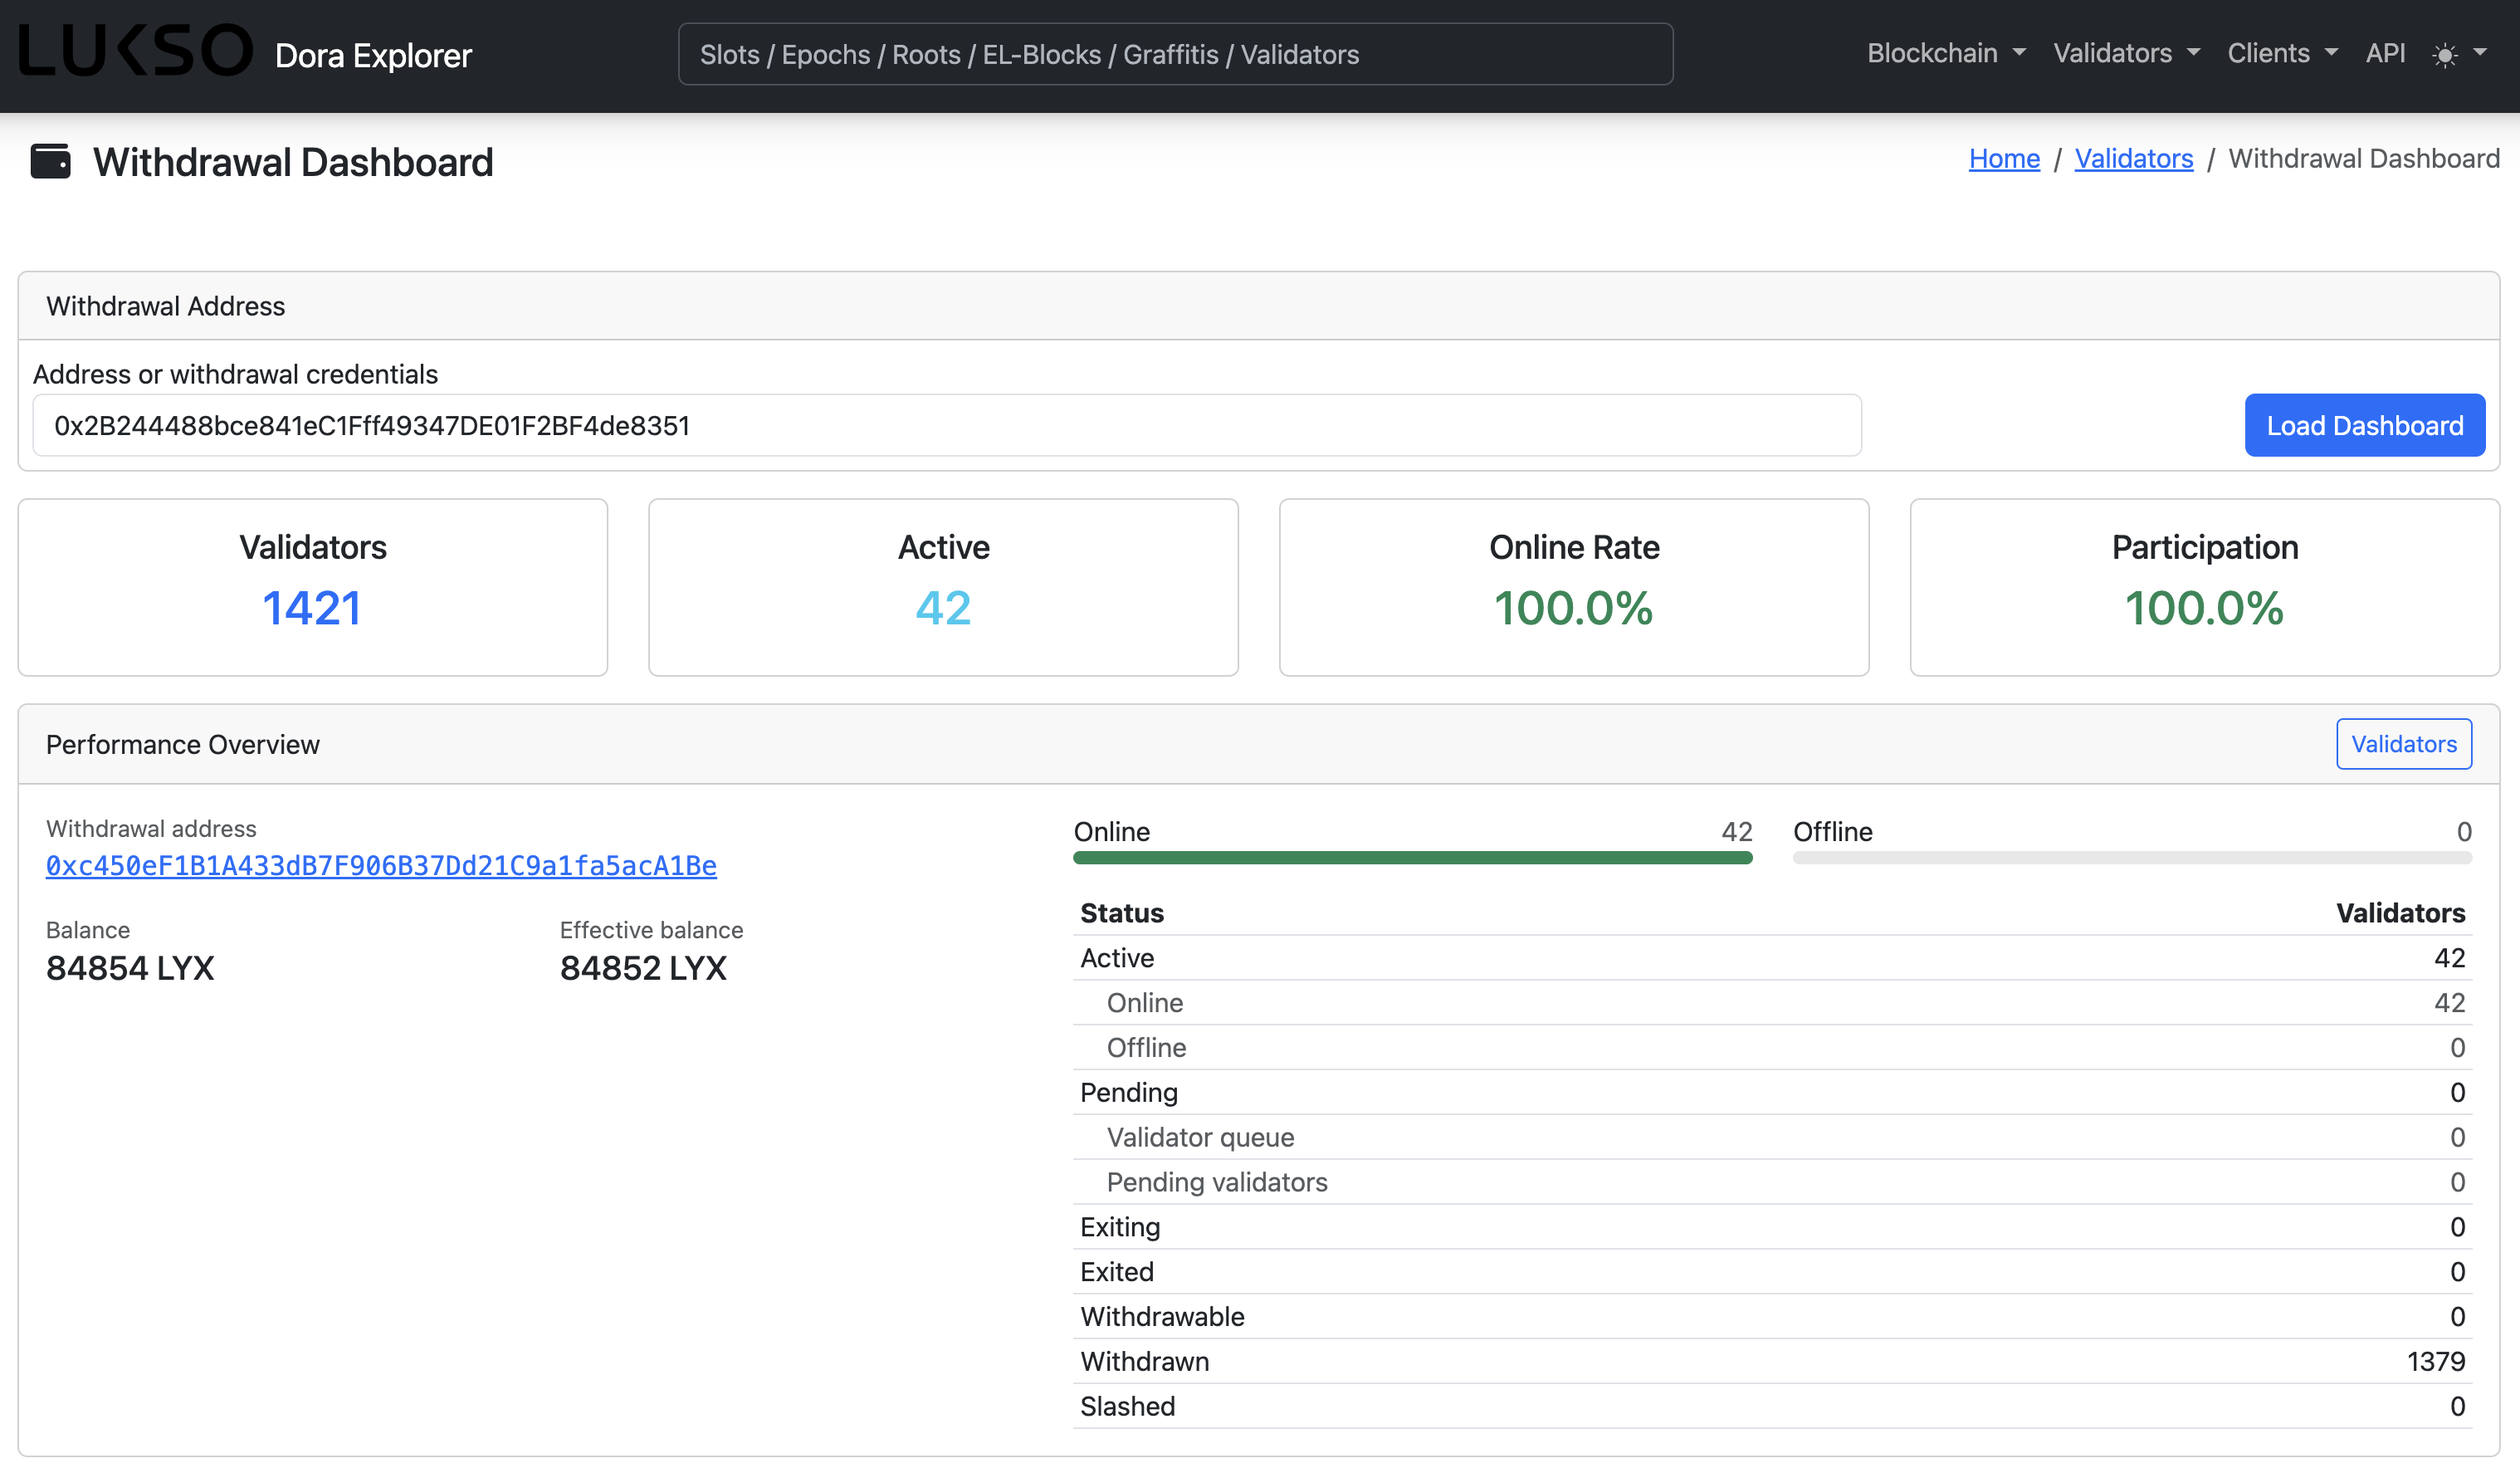
Open the LUKSO Testnet's Dora Explorer and input your withdrawal address too see all linked validators, their total uptime rate and balance, and various withdrawal metrics.
If you have multiple withdrawal addresses, open another window and repeat the process.
Up to 100 validator keys can be added in a single URL. If exceeded, you must split keys across multiple links.
The following steps are performed on your 📟 node server.
1. Move into Node Folder: Navigate into your log folder within your node setup.
- Mainnet
- Testnet
cd
cd <lukso-working-directory>/mainnet-logs/
cd
cd <lukso-working-directory>/testnet-logs/
Exchange <lukso-working-directory> with the actual folder name of your node setup.
2. Search Resent Log File: Find the latest validator log file to retrieve the imported validators.
find . -type f -name "*validator*" -printf "%T@ %p\n" | sort -n | tail -1 | awk '{print $2}'
Full Command Description
| Component | Description |
|---|---|
find . | Current directory as the starting point for the file search. |
-type f | Tells find to only consider regular files and ignore directories. |
-name "*validator*" | Matches files with "validator" anywhere in their names. |
-printf "%T@ %p\n" | Formats the output to show modification time %T@ followed by the path %p. |
sort -n | Pipes the list and sorts the lines numerically by the modification time. |
tail -1 | Selects the last line, corresponding to the most recently modified file. |
awk '{print $2}' | Extracts and prints the file path from the output line. |
3. Create Monitoring Link: Search the most recent log file and access all imported validators.
- Mainnet
- Testnet
cat <validator-log.log> | grep -o 'index=[0-9]* ' | awk -F'=' '{printf "%s,", $2}' | sed 's/,$//' | tr -d ' ' | awk '{print "https://dora.explorer.mainnet.lukso.network/api/v1/validator/" $0}'
cat <validator-log.log> | grep -o 'index=[0-9]* ' | awk -F'=' '{printf "%s,", $2}' | sed 's/,$//' | tr -d ' ' | awk '{print "https://dora.explorer.testnet.lukso.network/api/v1/validator/" $0}'
Exchange <validator-log.log> with the actual filename of the most recent validator log file.
Full Command Description
| Component | Description |
|---|---|
cat file | Displays all file contents including all the validator information. |
grep -o 'index=[0-9]* ' | Extracts all occurrences of index= followed by digits, using -o to return only matching parts. |
awk -F'=' '{printf "%s,", $2}' | Splits each match on =, and prints only the validator number followed by a comma. |
sed 's/,$//' | Removes the trailing comma from the end of the list. |
tr -d ' ' | Deletes all spaces from the output, resulting in a compact list of comma-separated index numbers. |
awk '{print URL $0}' | Prepends the URL to the entire index string, constructing a full link. |
The output will look similar to this one, having all your index numbers:
https://dora.explorer.mainnet.lukso.network/api/v1/validator/111,222,888
4. Access Validator Page: Copy and open the link to gather the JSON file with uptime, proposal, and withdrawal metrics.
{
  "status": "OK",
  "data": [
    {
      "activationeligibilityepoch": 0,
      "activationepoch": 0,
      "balance": 32003585657,
      "effectivebalance": 32000000000,
      "exitepoch": 1.8446744073709552e19,
      "isonline": true,
      "name": "",
      "pubkey": "0xb0e97973ba0b1c4aeba97ba24da85364a6265b546013a53e0543f350242f1dbfcbaeec6c2856b2aa990cb37ed14f8bcc",
      "slashed": false,
      "status": "active_ongoing",
      "validatorindex": 111,
      "withdrawableepoch": 1.8446744073709552e19,
      "withdrawalcredentials": "0x0100000000000000000000008032f01f712c942520dfb9598153c4edb7c39b85"
    },
    {
      "activationeligibilityepoch": 0,
      "activationepoch": 0,
      "balance": 32003596620,
      "effectivebalance": 32000000000,
      "exitepoch": 1.8446744073709552e19,
      "isonline": true,
      "name": "",
      "pubkey": "0xb093abb88a6197d483ad4e3a53fd237aa3f7c7ca42dff9a59d32f6cfe1445a3dcbd68585d41b2df45d8d6c4180985d33",
      "slashed": false,
      "status": "active_ongoing",
      "validatorindex": 222,
      "withdrawableepoch": 1.8446744073709552e19,
      "withdrawalcredentials": "0x010000000000000000000000f7d385bc2d5173f2f013d694e8d9e8c3440638d9"
    },
    {
      "activationeligibilityepoch": 0,
      "activationepoch": 0,
      "balance": 0,
      "effectivebalance": 0,
      "exitepoch": 216010,
      "isonline": false,
      "name": "",
      "pubkey": "0xabdefc3e8610fe49f071be6b4d9e8ce3c5492913f735ed11c58436b9e31ab62892ae3eae5760dc343fb392b972dcf737",
      "slashed": false,
      "status": "withdrawal_done",
      "validatorindex": 888,
      "withdrawableepoch": 216266,
      "withdrawalcredentials": "0x0100000000000000000000003c54dbe1b541cf91b83e2fad541c87121b4556e9"
    }
  ]
}
Safe the link in your notes or as browser bookmark to be able to check the validator status from any device.