9.4 Custom Messages
Grafana's default alert messages often include excessive technical details and raw values that make it difficult to quickly assess the situation or determine next steps. This guide walks you through how to customize and simplify those messages using annotations and templates, helping you to get actionable alerts across any Grafana version.
- Default Firing Message
- Default Resolved Message
**Firing**

Value: B=45.07955651176187, C=1
Labels:
 - alertname = Participation Rate below 80%
 - grafana_folder = node-alerts
 - instance = 127.0.0.1:8080
 - job = consensus-client-job
Annotations:
Source: http://localhost:3000/alerting/grafana/e10d1256-082f-4ca3-a936-aceea7759d78/view?orgId=1
Silence: http://localhost:3000/alerting/silence/new?alertmanager=grafana&matcher=alertname%3DParticipation+Rate+below+80%25&matcher=grafana_folder%3Dnode-alerts&matcher=instance%3D127.0.0.1%3A8080&matcher=job%3Dconsensus-client-job
Dashboard: http://localhost:3000/d/dashboard-id?orgId=1
Panel: http://localhost:3000/d/dashboard-id?orgId=1&viewPanel=120
**Resolved**

Value: B=85.07955651176187, C=1
Labels:
 - alertname = Participation Rate below 80%
 - grafana_folder = node-alerts
 - instance = 127.0.0.1:8080
 - job = consensus-client-job
Annotations:
Source: http://localhost:3000/alerting/grafana/e10d1256-082f-4ca3-a936-aceea7759d78/view?orgId=1
Silence: http://localhost:3000/alerting/silence/new?alertmanager=grafana&matcher=alertname%3DParticipation+Rate+below+80%25&matcher=grafana_folder%3Dnode-alerts&matcher=instance%3D127.0.0.1%3A8080&matcher=job%3Dconsensus-client-job
Dashboard: http://localhost:3000/d/dashboard-id?orgId=1
Panel: http://localhost:3000/d/dashboard-id?orgId=1&viewPanel=120
Add Message Annotations
First, we have to add custom or additional context to the alert rule, that can later be displayed within our custom message.

You can further customize the summary and description annotations beyond the default values in the following steps.
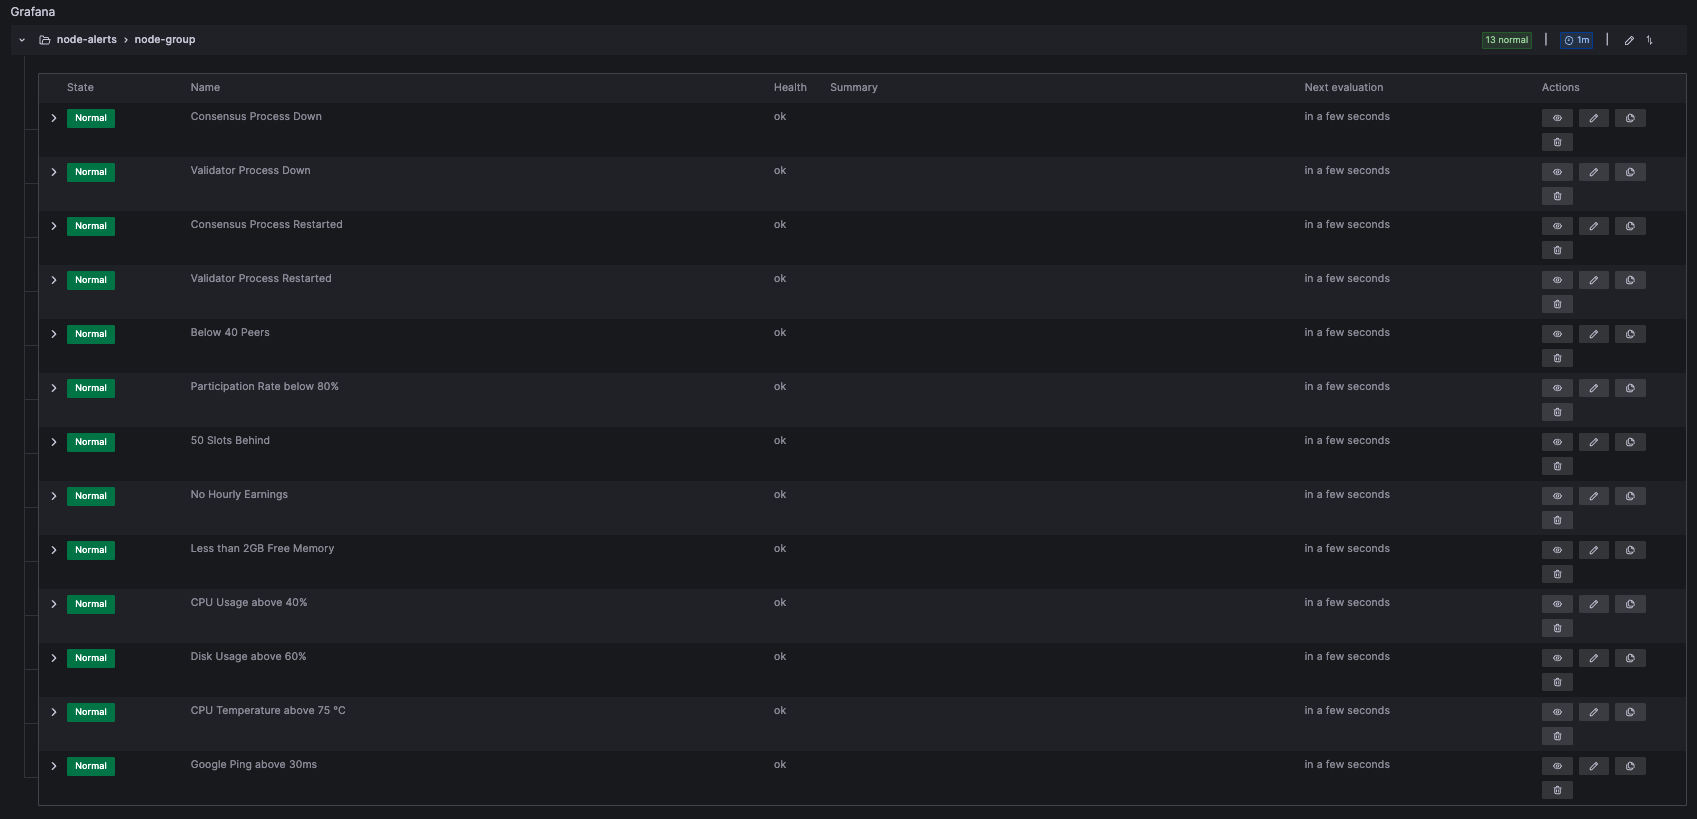
- Navigate to the Alert Rules from the top right menu of Grafana.
- Edit the Alert Rule by clicking the Edit Icon on the right side of the list.
- Copy the Name and scroll down the Annotations to Configure the Notification Message.
- Choose the Summary annotation and input the previously copied Alert Rule Name.
- Choose the Description annotation and input
{{ $values.B.Value }}to reference the triggering value. - Safe and Exit the Alert Rule and repeat the process for all the remaining rules.
If you modified the default alert rules that were set up within the Grafana Notifications, you can exchange the referenced value with {{ $values.C.Value }} or {{ $values.D.Value }} depending on the applied rules at the top of the page.
Edit Contact Point Message
Once your alert rules are filled, you have to customize how the messages are sent via contact points. In Grafana, contact points aggregate the alert rules and manage how it's data is delivered through your notification setup. Using contact points, you have the chance to write fully customized messages and texts depending on what data is abailable or which rule is triggered.
- Navigate to the Contact Points from the top right menu of Grafana.
- Edit your Telegram Contact Point by clicking the Edit Icon on the right side of the list.
- Within the Integration Section, extend the Optional Telegram Settings.
- On the Message heading, click Edit Message to customize your text.
- Click Enter Custom Message and paste the following preset, then hit safe
- On the Contact Point Page, click Safe Contact Point.
{{ range .Alerts }}
LUKSO Alert Rule is: {{ .Status }}
Summary: {{ .Annotations.summary }}
Value: {{ .Annotations.description }}
{{ end }}
If you want to test messages, you can use the Test Icon on the Contact Point Page to send example notifications. To test the Alert Rules in production, you can modify a metric so it is triggered Immediately and sends off a message.
Your updated Telegram Messages will now look like the following:
- New Firing Message
- New Resolved Message
LUKSO Alert Rule is firing
Summary: Disk Usage above 60%
Value: 0.7462574211663442
LUKSO Alert Rule is resolved
Summary: Disk Usage above 60%
Value: 0.2462574211663442
Further message templates and customization options can be found on the Grafana Contact Points Documentation.