9.2 Grafana Notifications
Grafana Notifications allow you to monitor the health of your node and its components in real-time. By configuring alerts for critical metrics, you can proactively resolve issues before they impact performance or security. Once a notification channel like Telegram, Discord or E-Mail has been set up, you will be able to configure custom rules on when the Grafana Dashboard sends messages based on gathered metrics.
This guide uses the default Grafana 📝 Templates to configure notification behaviour.
The following steps are performed on your 💻 personal computer.
1. Add Notifications
To be notified once some process is down or something is off, you will have to create notifications for every metric.
- Click the Granfana Icon to get to the Landing Page and select the LUKSO Dashboard from the list.
- Scroll down to the dashboard's Alerts section, select an alert, and click Edit on the 3-Dot-Menu on the right side.
- Within the Alert tab, select Create Alert Rule from this Panel to open up a new window.
- Click Preview to print out the graph and adjust the Threshold section to your likings on when the alert should happen.
- In case the Reduce section is showing NaN, Replace Non-numeric Values with a custom number above the alert range.
- For metrics that rely on the network, its recommended to set a NaN value, so it triggers when the network is down.
- Within the Alert Evaluation Behavior section, add a node-alerts folder where all the alert data will be stored.
- Within the Evaluation Group selection, add a node-group or select it from the panel.
- Its recommended to always choose the same alert folder and group for one node, so you do not mix up any targets.
- Scroll up and click Save to enable this alert for the specific metric.
The steps need to be repeated for every Alert on the Grafana Dashboard you want to receive notifications for.
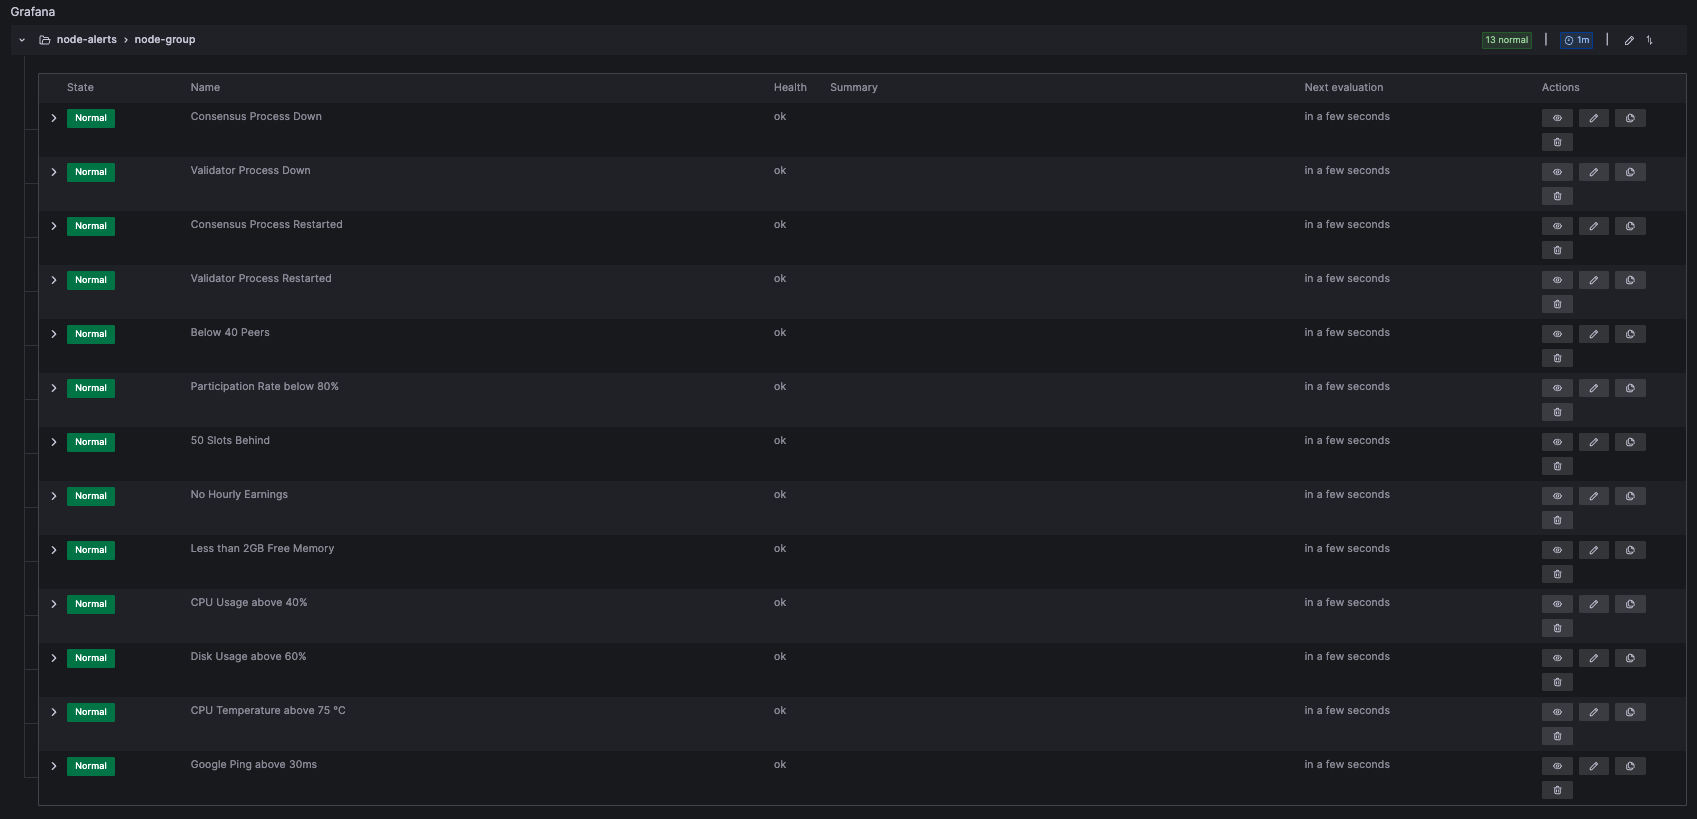
2. Set Metrics Presets
This section outlines every alert setup from the default dashboard. You can check the picures and validate your configurations.
Below metric presets are based on default Grafana 📝 Templates. If you used different service job names within the Prometheus Dataset Configuration, you will have to adjust the job names to match your Prometheus installation.
Alert: Consensus Process Down
1: Process up
0: Process down
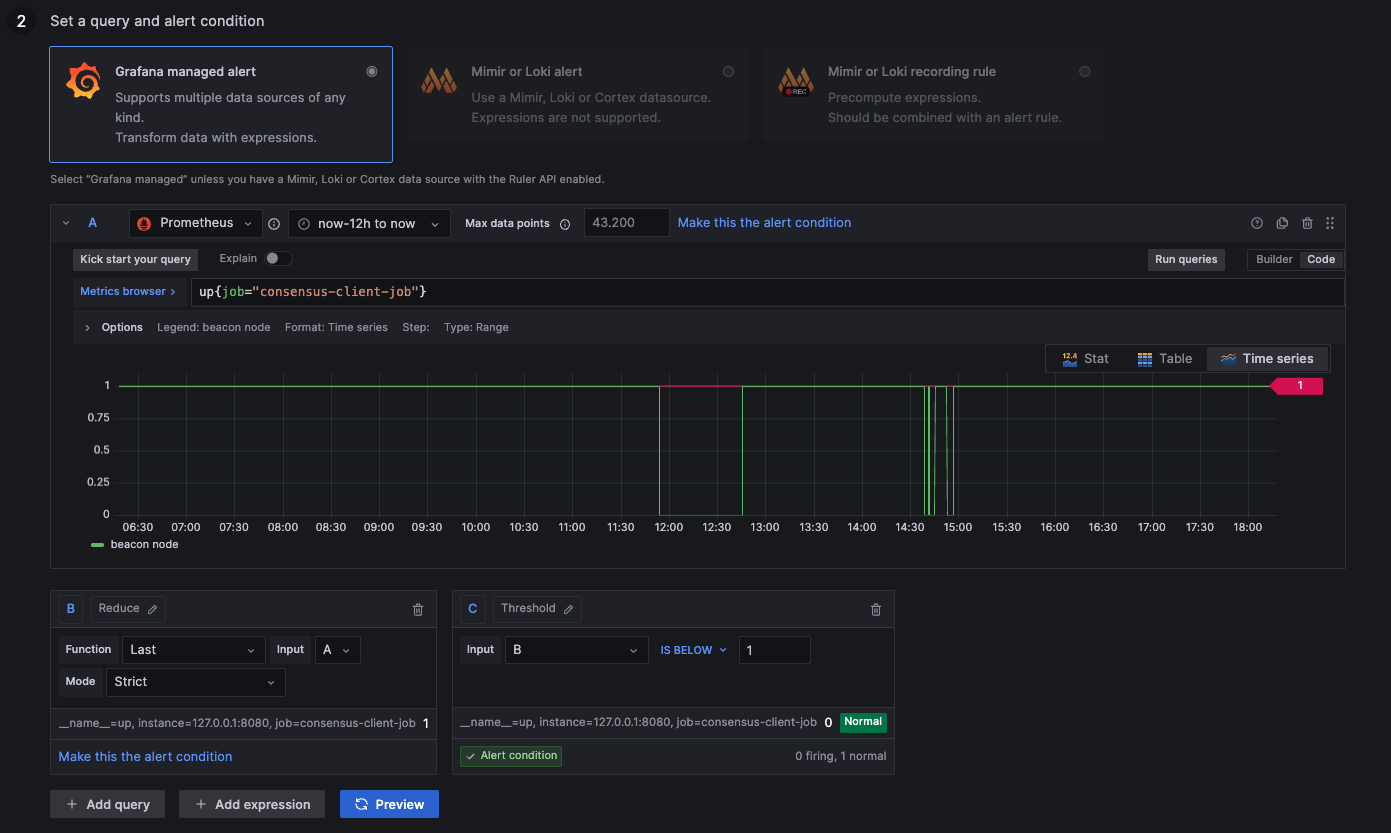
- Lighthouse, Prysm, Teku
- Nimbus-Eth2
up{job="consensus-client-job"}
up{job="beacon-client-job"}
Alert: Validator Process Down
1: Process up
0: Process down
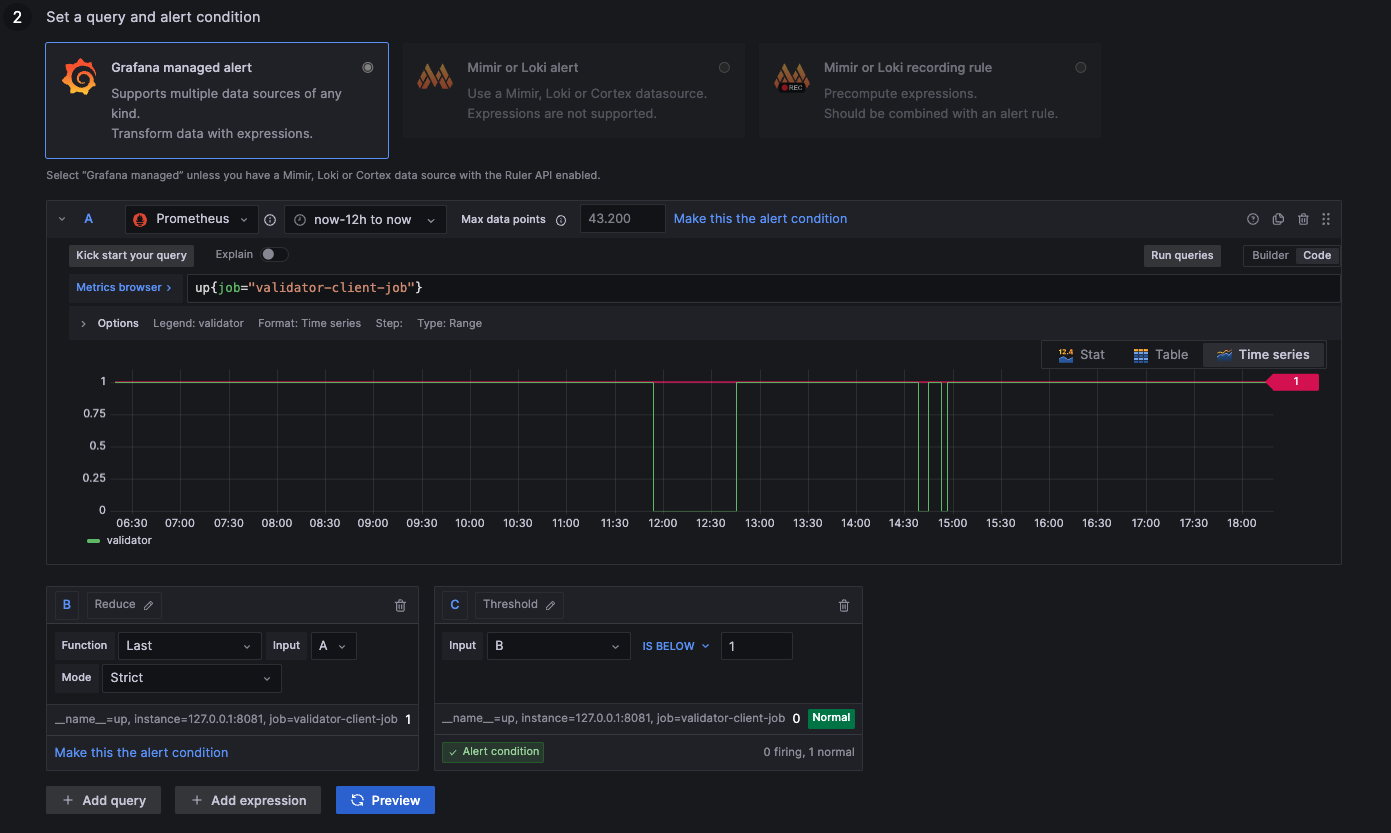
- Lighthouse, Prysm, Teku
up{job="validator-client-job"}
The Validator Proccess Down Alert does not exist for Nimbus-Eth2, as it uses a single Beacon Proccess.
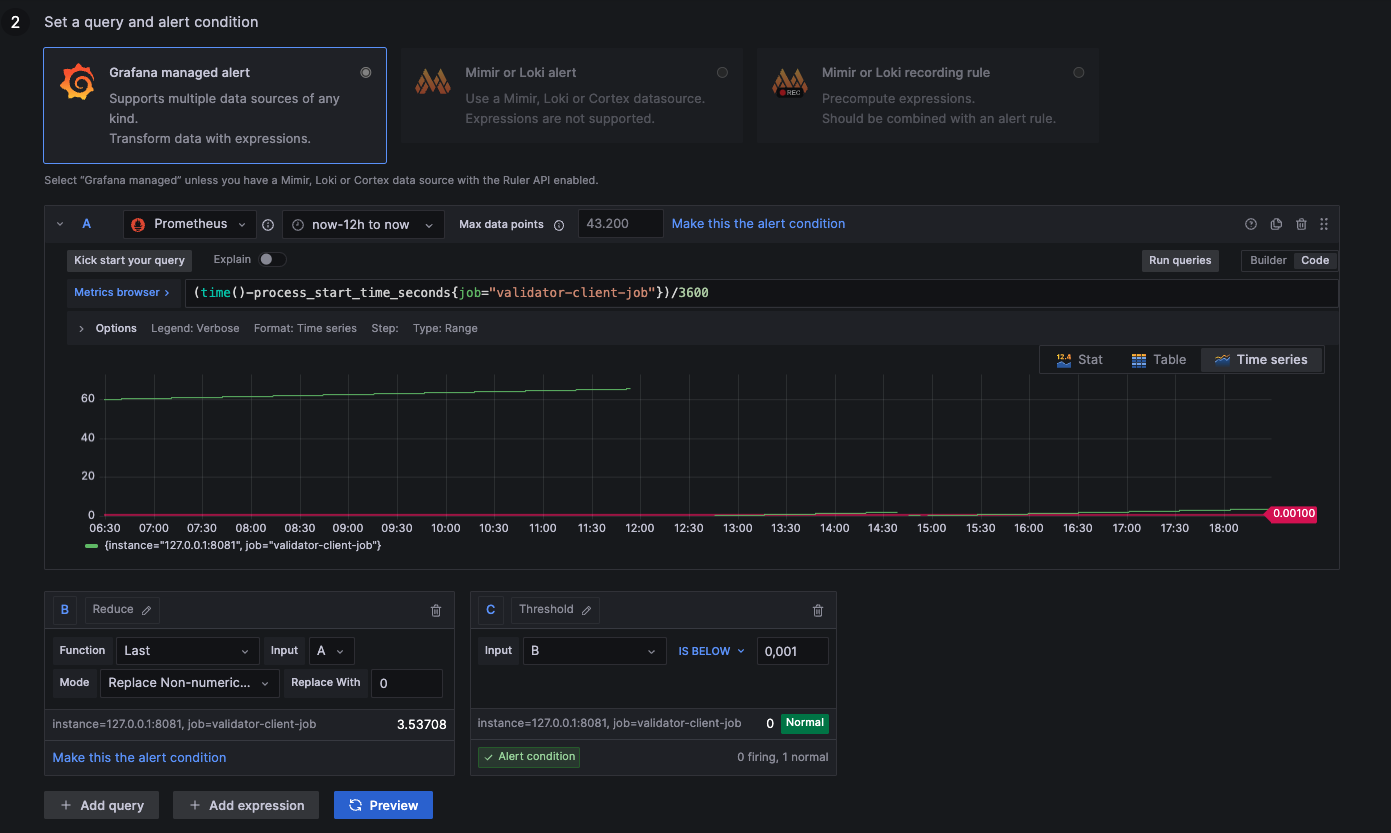
Alert: Consensus Process Restarted
1:   Process up
0:   Process down
NaN: Not available (likely down --> 0)
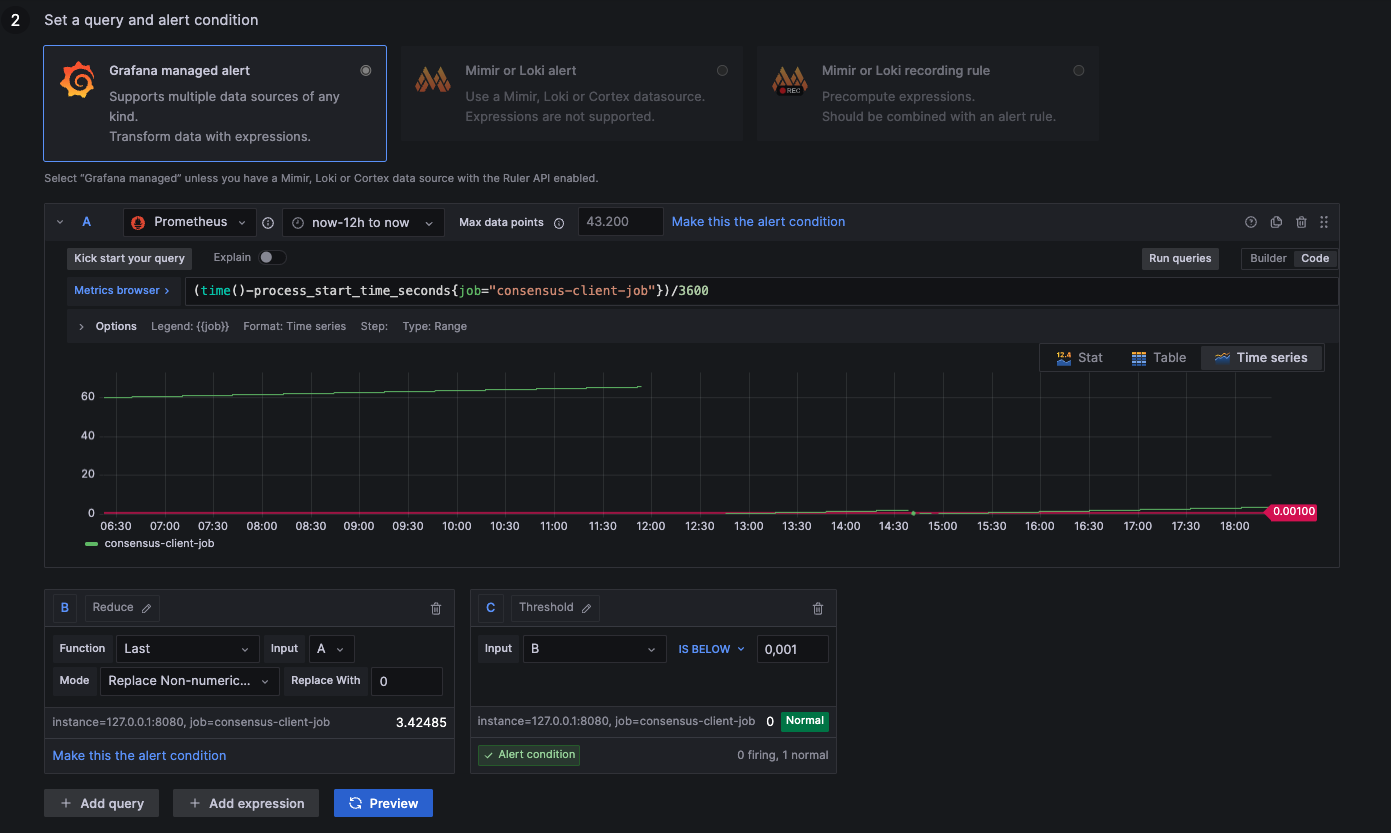
- Lighthouse, Prysm, Teku
- Nimbus-Eth2
(time()-process_start_time_seconds{job="consensus-client-job"})/3600
(time()-process_start_time_seconds{job="beacon-client-job"})/3600
Alert: Validator Process Restarted
1:   Process up
0:   Process down
NaN: Not available (likely down --> 0)
- Lighthouse, Prysm, Teku
(time()-process_start_time_seconds{job="validator-client-job"})/3600
The Validator Proccess Restarted Alert does not exist for Nimbus-Eth2, as it uses a single Beacon Proccess.
Alert: Below 40 Peers
above 30: Ideal healthy connections
below 30: Resyncing or weak connections
NaN:      Not available (no connections --> 0)
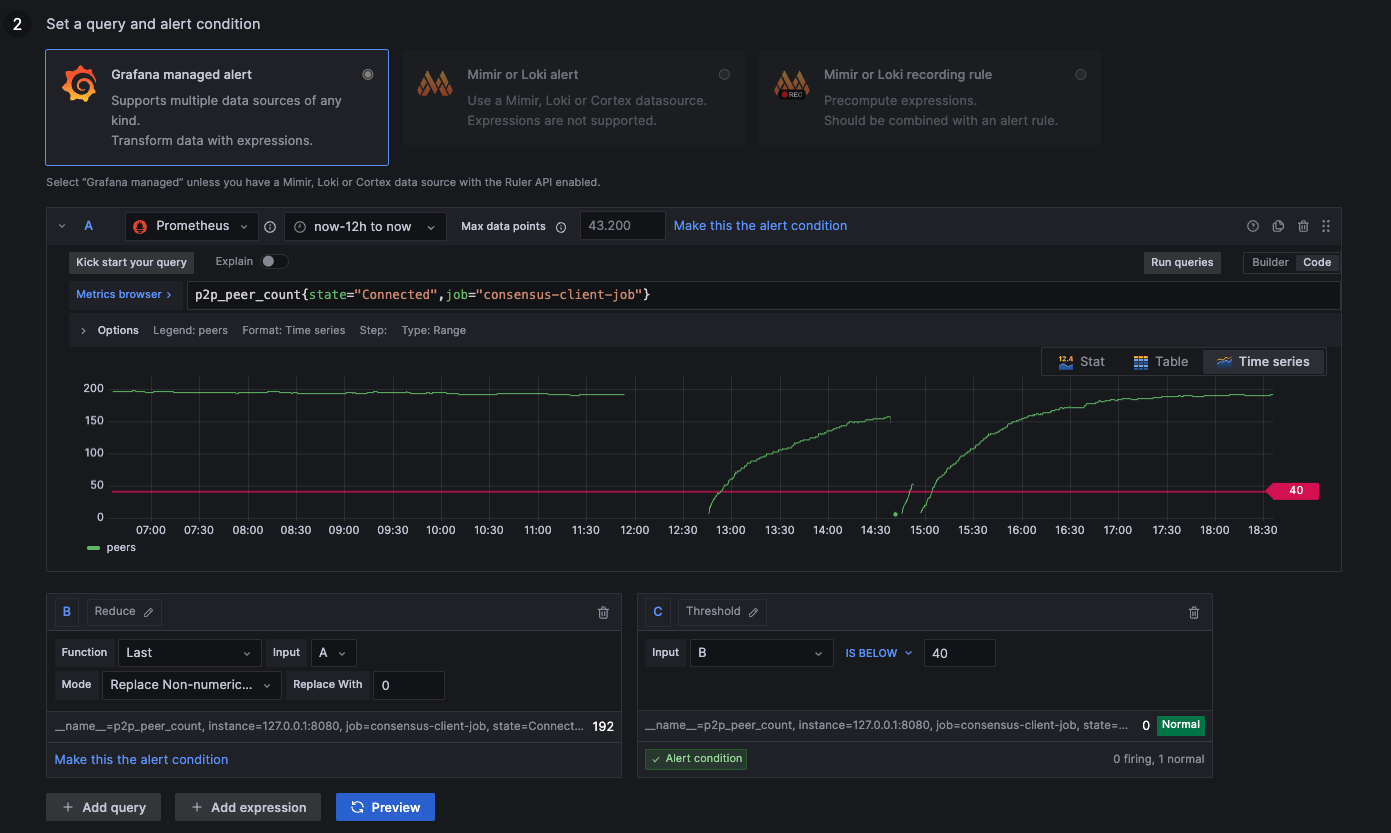
- Lighthouse & Prysm
- Teku
- Nimbus-Eth2
p2p_peer_count{state="Connected",job="consensus-client-job"}
libp2p_peers{job="consensus-client-job"}
connected_libp2p_peers{job="beacon-client-job"}
Alert: Participation Rate below 80%
above 80: Ideal healthy network
below 80: Unstable network
NaN:      2nd data feed (ignore metric --> 100)
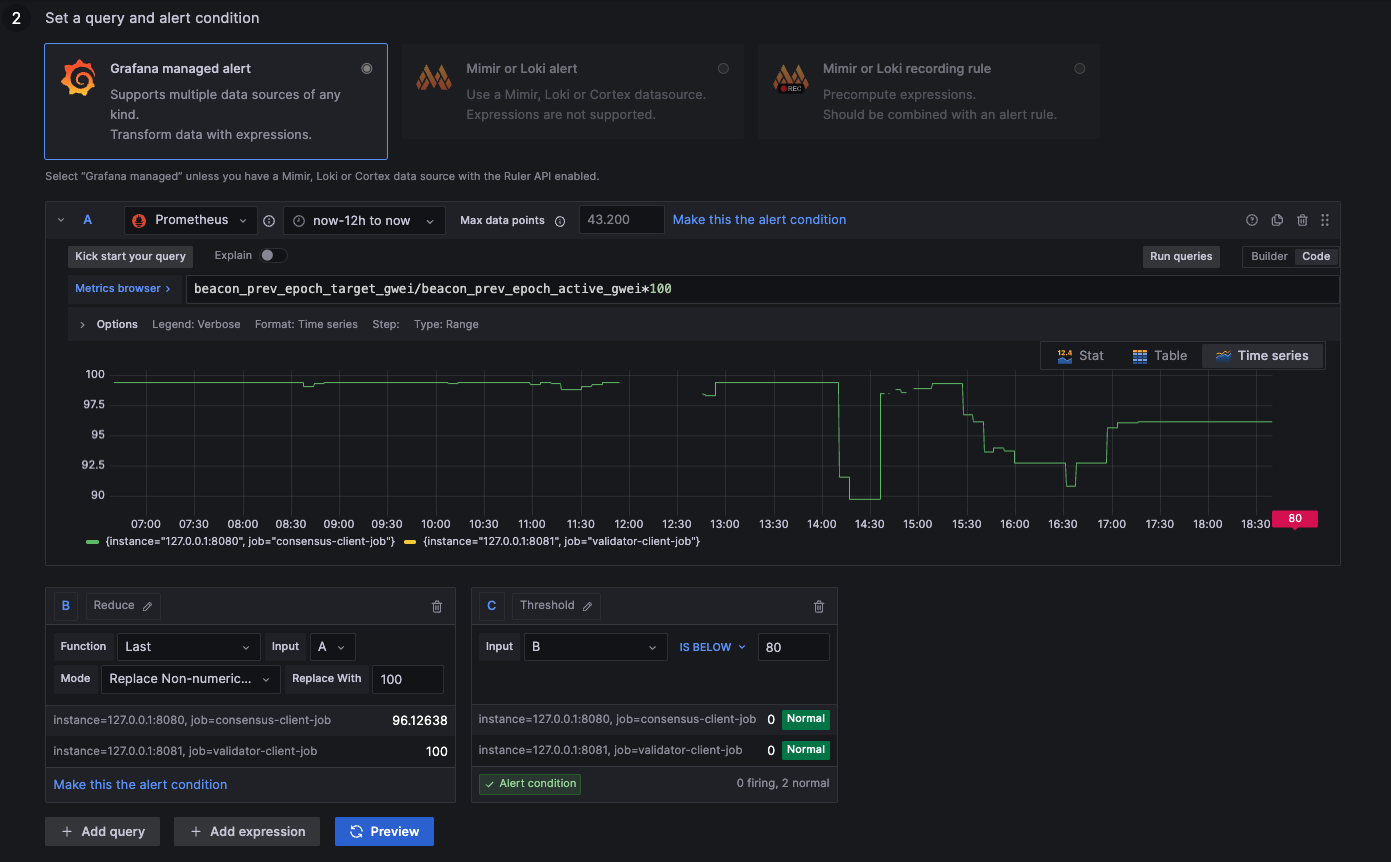
- Lighthouse, Prysm, Teku
- Nimbus-Eth2
(beacon_prev_epoch_target_gwei{job="consensus-client-job"} / beacon_prev_epoch_active_gwei{job="consensus-client-job"}) *100
(beacon_prev_epoch_target_gwei{job="beacon-client-job"} / beacon_prev_epoch_active_gwei{job="beacon-client-job"}) *100
Alert: 50 Slots Behind
below 50: Ideal syncing speed
above 50: Unstable syncing
NaN:      Not available (likely unstable --> 51)
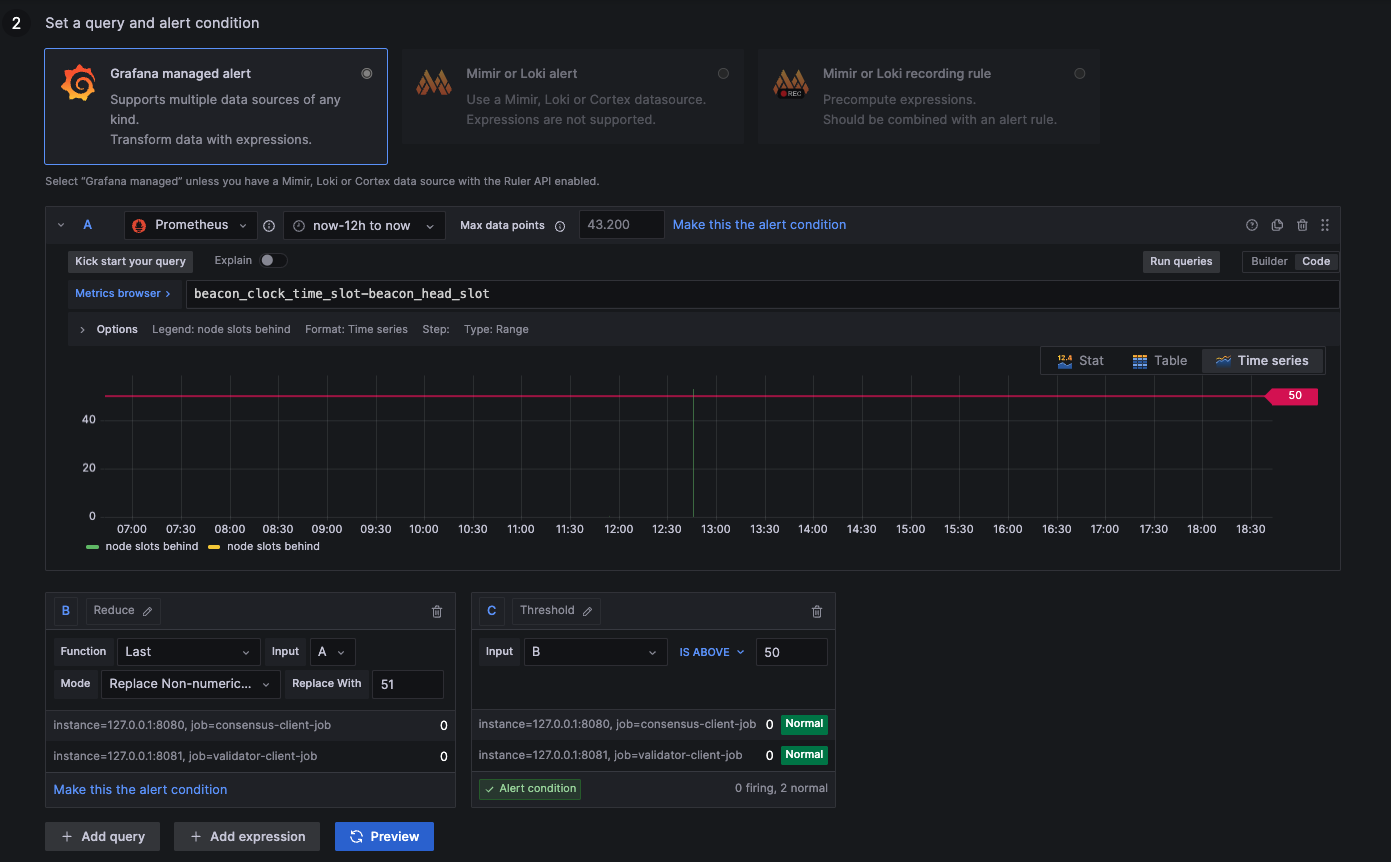
- Prysm & Teku
- Lighthouse
- Nimbus-Eth2
beacon_clock_time_slot{job="consensus-client-job"} - beacon_head_slot{job="consensus-client-job"}
slotclock_present_slot{job="consensus-client-job"} - beacon_head_slot{job="consensus-client-job"}
beacon_clock_time_slot{job="beacon-client-job"} - beacon_head_slot{job="beacon-client-job"}
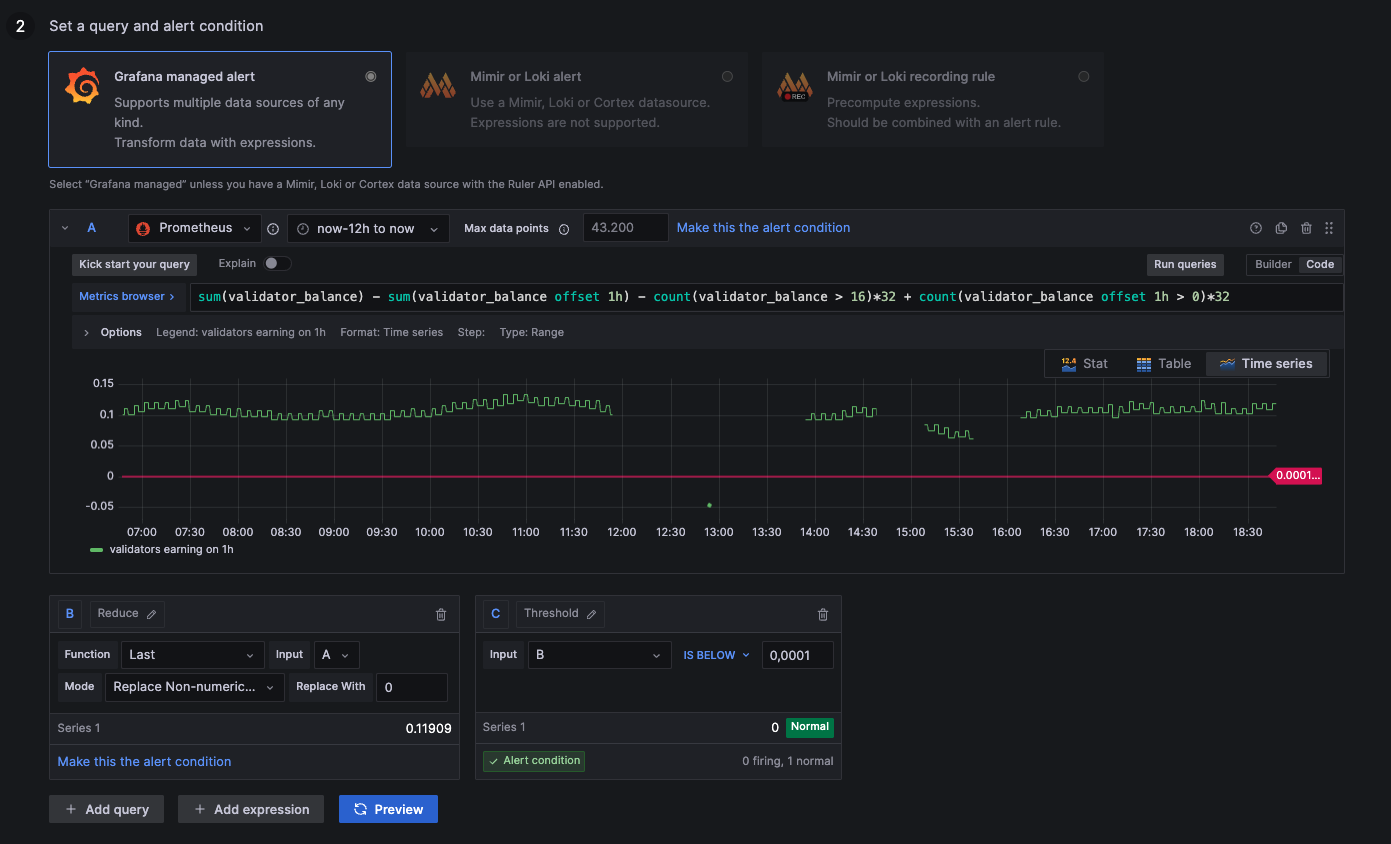
Alert: No Hourly Earnings
The metrics for node earnings use a fixed value of 32 LYX. Since the Pectra Fork, a single validator key can hold up to 2048 LYX. If your validators stake with a higher amount than 32 LYX, please adjust the values manually.
above 0,0001: Earning rewards
below 0,0001: Syncing or negative rewards
NaN:          Not available (likely negative rewards --> 0)
- Prysm
- Lighthouse
- Nimbus-Eth2
sum(validator_balance{job="validator-client-job"}) - sum(validator_balance{job="validator-client-job"} offset 1h != 0) - (32 * count(validator_balance{job="validator-client-job"} > 16)) + (32 * count(validator_balance{job="validator-client-job"} offset 1h > 16))
((sum(validator_monitor_balance_gwei{job="validator-client-job"}) - sum(validator_monitor_balance_gwei{job="validator-client-job"} offset 1h != 0)) / 1e9) - (32 * count(validator_monitor_status{job="validator-client-job",status="active_ongoing"})) + (32 * count(validator_monitor_status{job="validator-client-job",status="active_ongoing"} offset 1h))
((sum(validator_monitor_balance_gwei{job="beacon-client-job"}) - sum(validator_monitor_balance_gwei{job="beacon-client-job"} offset 1h != 0)) / 1e9) - 32 * count(validator_monitor_status{job="beacon-client-job",status="active_ongoing"}) + 32 * count(validator_monitor_status{job="beacon-client-job",status="active_ongoing"} offset 1h)
The Hourly Earnings Alert does not exist for Teku, as it's client does not expose any Validator Balance Metrics.
Alert: Less than 2GB Free Memory
above 2000000000: More than 2GB remaining
below 2000000000: Less than 2GB remaining
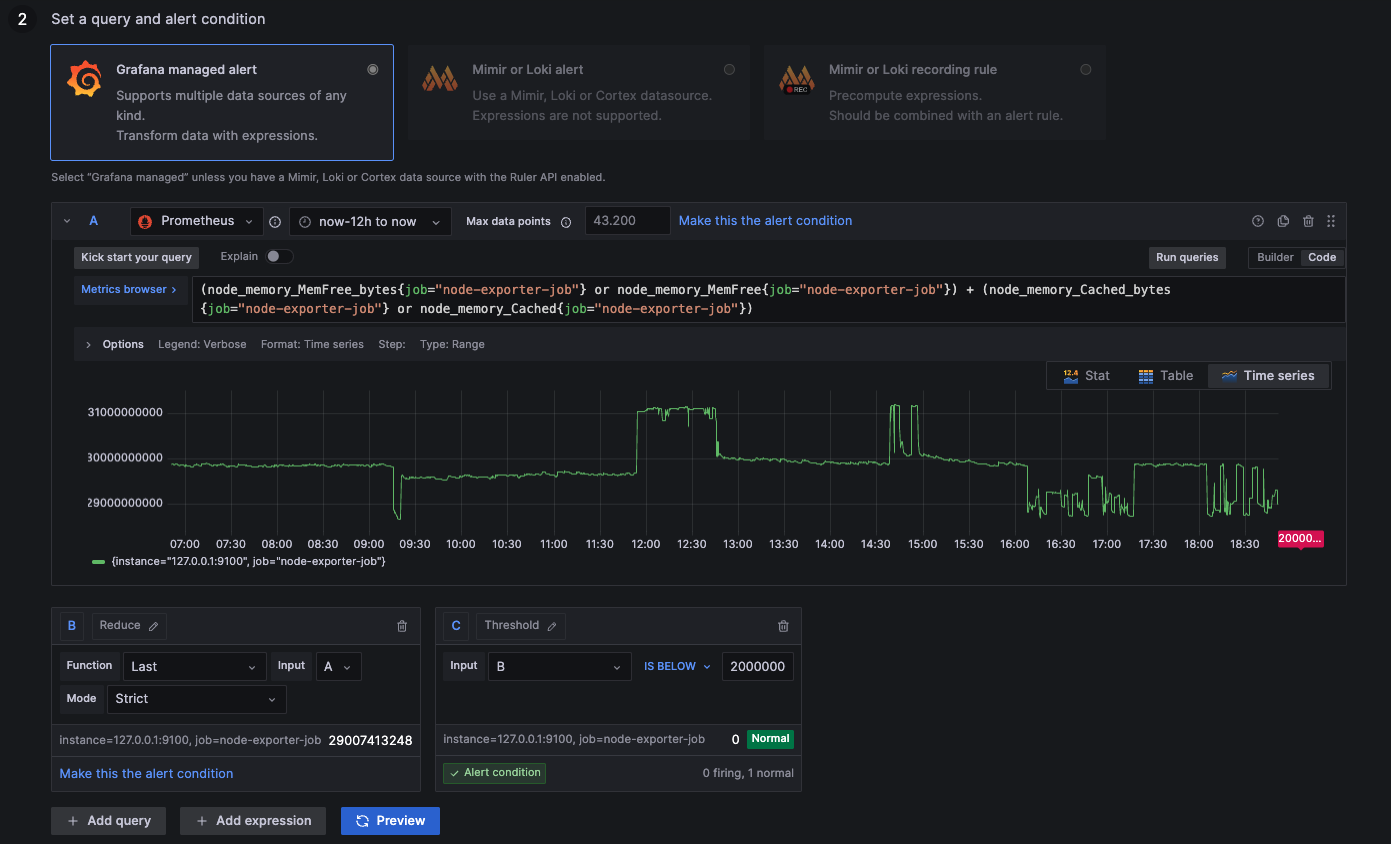
(node_memory_MemFree_bytes{job="node-exporter-job"} or node_memory_MemFree{job="node-exporter-job"}) + (node_memory_Cached_bytes{job="node-exporter-job"} or node_memory_Cached{job="node-exporter-job"})
Alert: CPU Usage above 40%
above 4: More than 40% of computation resources used
below 4: Less than 40% of computation resources used
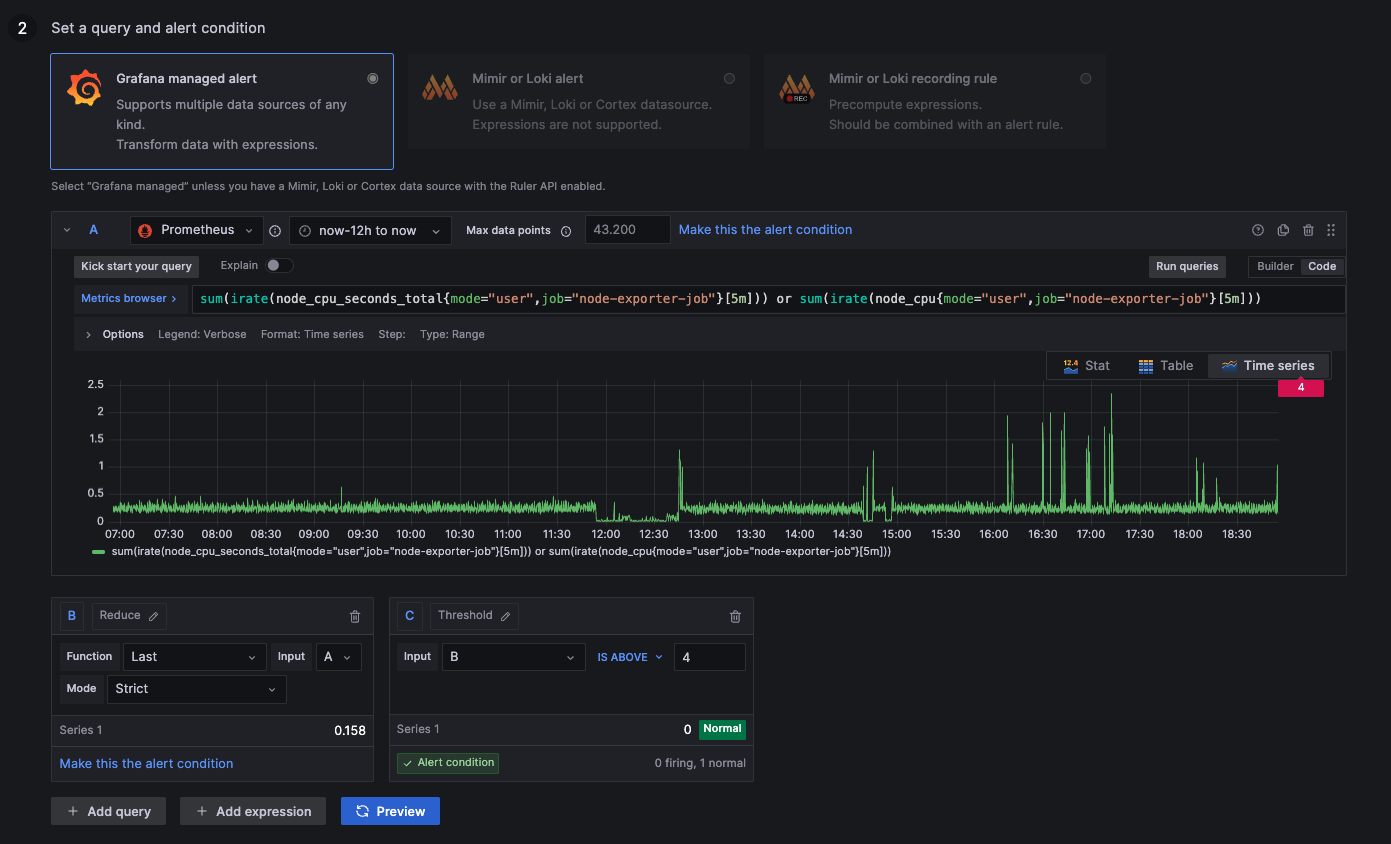
sum(irate(node_cpu_seconds_total{mode="user",job="node-exporter-job"}[5m])) or sum(irate(node_cpu{mode="user",job="node-exporter-job"}[5m]))
Alert: Disk Usage above 60%
above 0,6: Disk more than 60% occupied by tasks
below 0,6: Disk less than 60% occupied by tasks
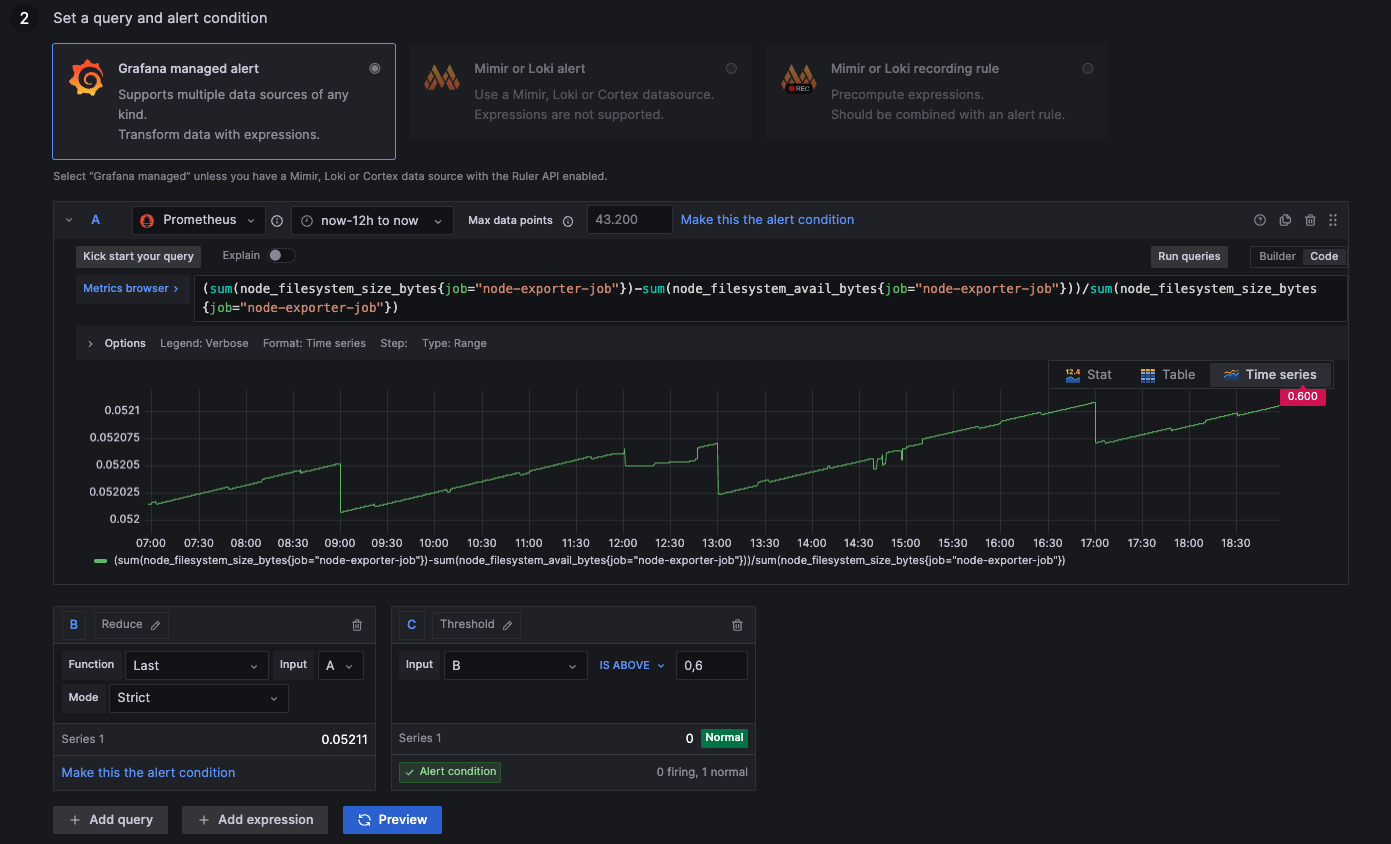
(sum(node_filesystem_size_bytes{job="node-exporter-job"})-sum(node_filesystem_avail_bytes{job="node-exporter-job"}))/sum(node_filesystem_size_bytes{job="node-exporter-job"})
Alert: CPU Temperature above 75 °C
above 75: Processor is running hot
below 75: Processor is running normally
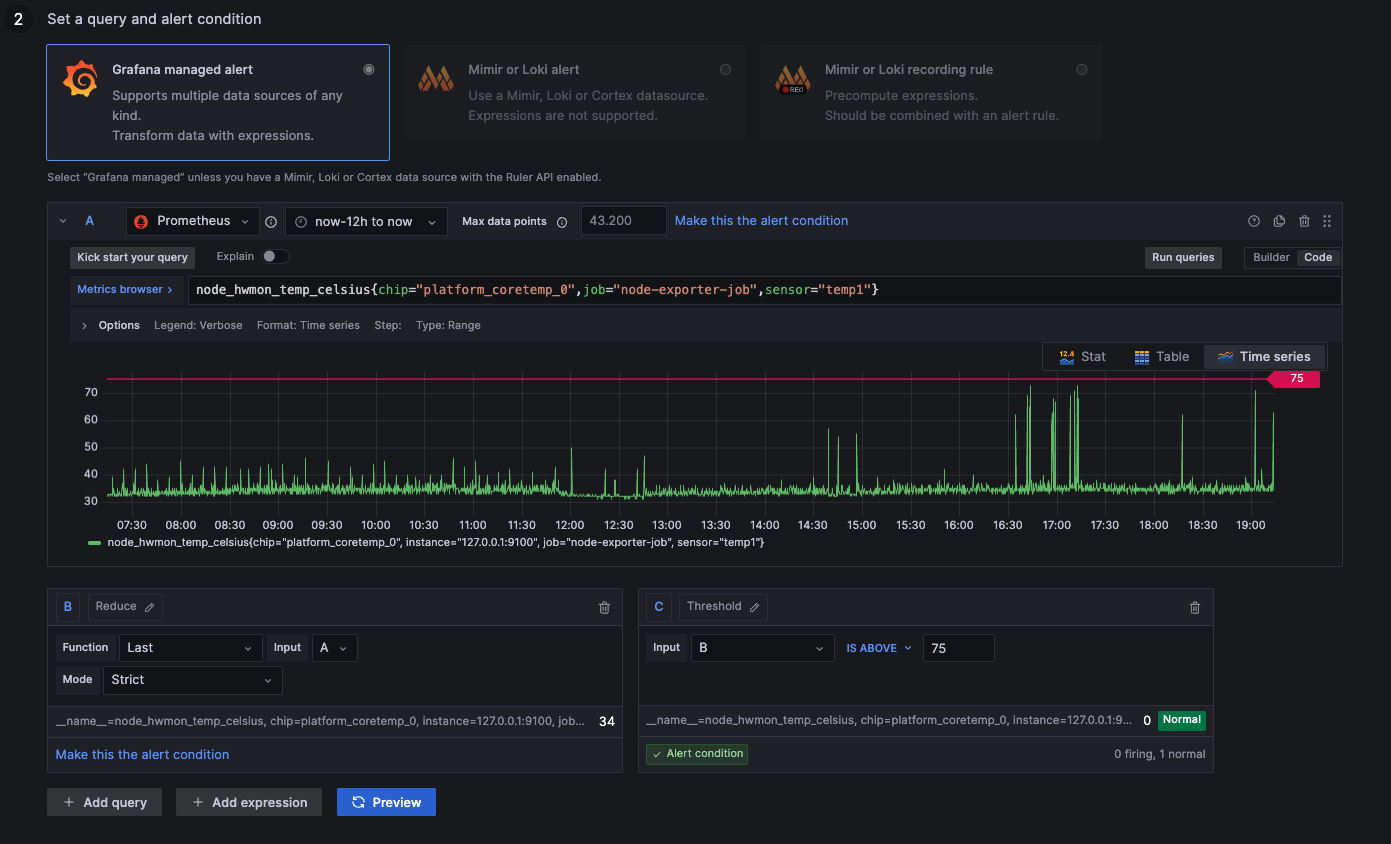
node_hwmon_temp_celsius{chip="platform_coretemp_0",job="node-exporter-job",sensor="temp1"}
Alert: Google Ping above 30ms
above 0,03: Connection takes longer than 30ms, not ideal
below 0,03: Connection takes less than 30ms, everything alright
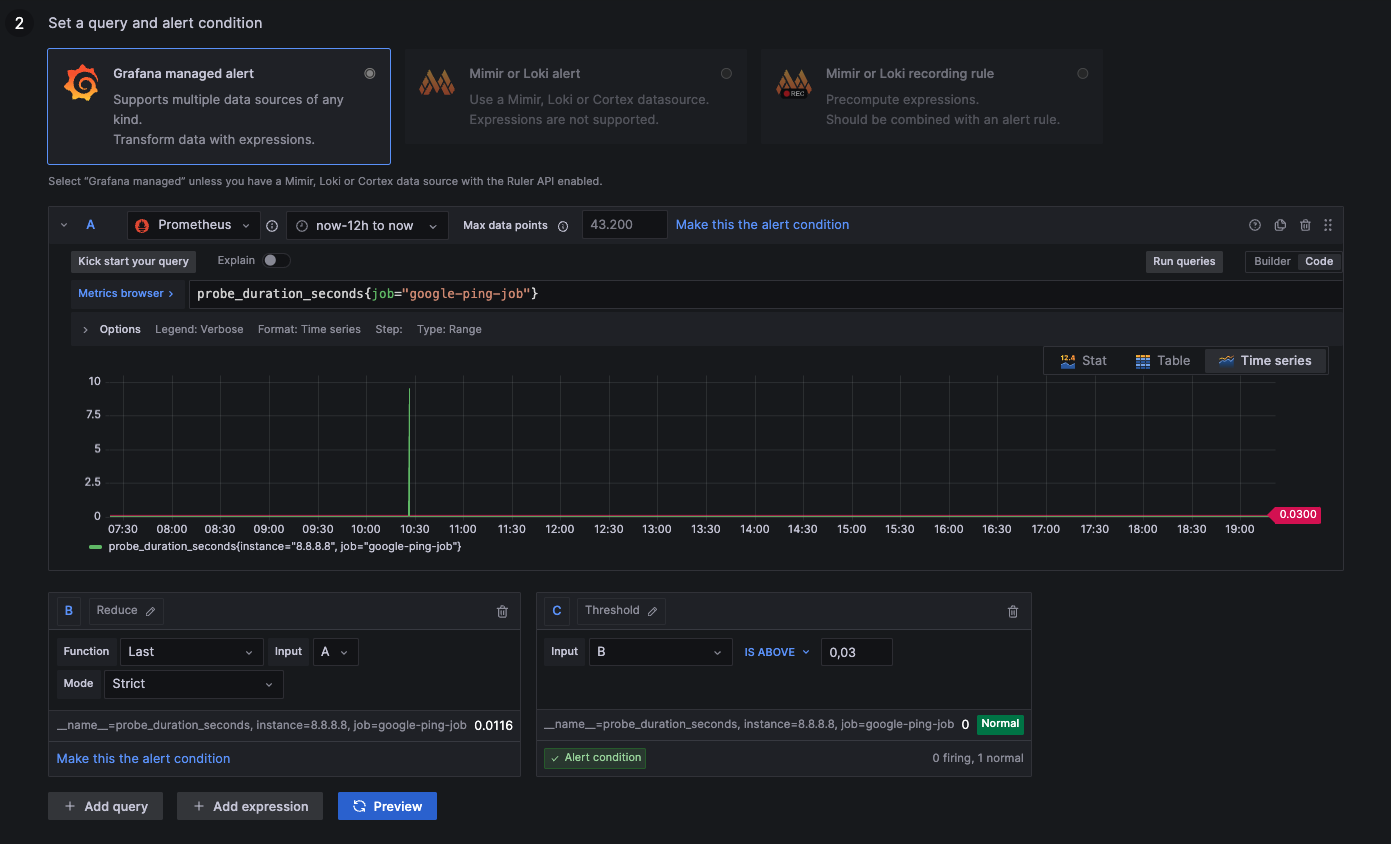
probe_duration_seconds{job="google-ping-job"}
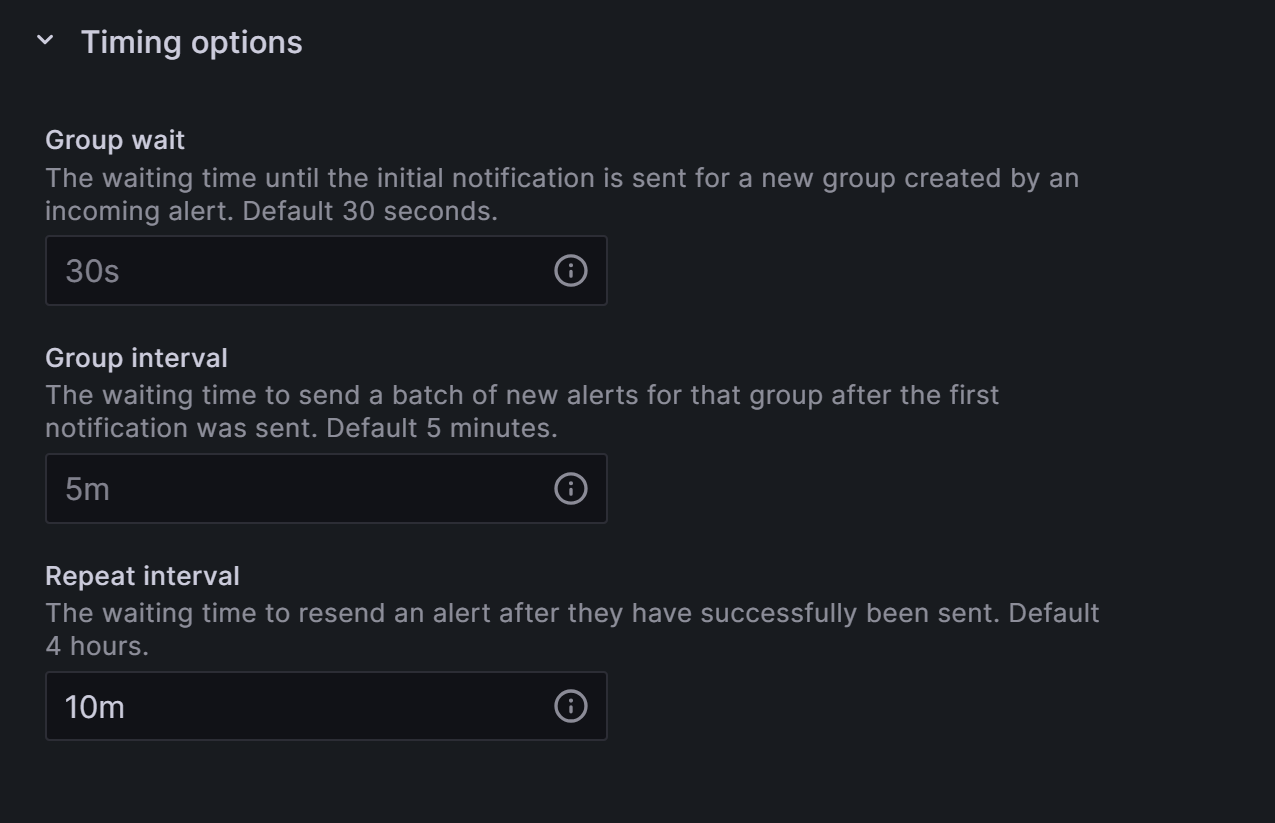
3. Configure Intervals
Once an alert is triggered, you can define how frequently the message will be sent out to your notification channel.
- Navigate to the Alerting section on the left menu and click on the Notification Policies heading.
- Select the 3-Dot-Menu on the default notification channel and choose Edit within the popup.
- Expand the Timing Options field to a duration or message frequency of your liking.
Besides intervals, Grafana will also send a Resolved message once the issue is not present anymore.
4. Continuous Notifications
Within the Grafana Dashboard, you can also enable Alert Reminders that send notifications after a certain period of time. Setting it to one hour will send a notification every hour if a critical error or status has not changed yet.
5. Permanent Alerts
For a metric to send out permanent notifications, you can clone or create a new alert rule for a metric and define a rule that it is never supposed to be reached, so it permanently triggers. If you want hourly updates on the participation rate, you could select the alert for under 100% participation. In this case, you would constantly get notified about the network participation.